Functions:
| Name | Description |
|---|---|
bollinger_bands | Bollinger band 기반 매수 및 매도 signal을 생성하는 function |
macd | MACD 기반 매수 및 매도 signal을 생성하는 function |
momentum | Momentum 기반 매수 및 매도 signal을 생성하는 function |
moving_average | 단기 및 장기 이동 평균 기반 매수 및 매도 signal을 생성하는 function |
rsi | RSI 기반 매수 및 매도 signal을 생성하는 function |
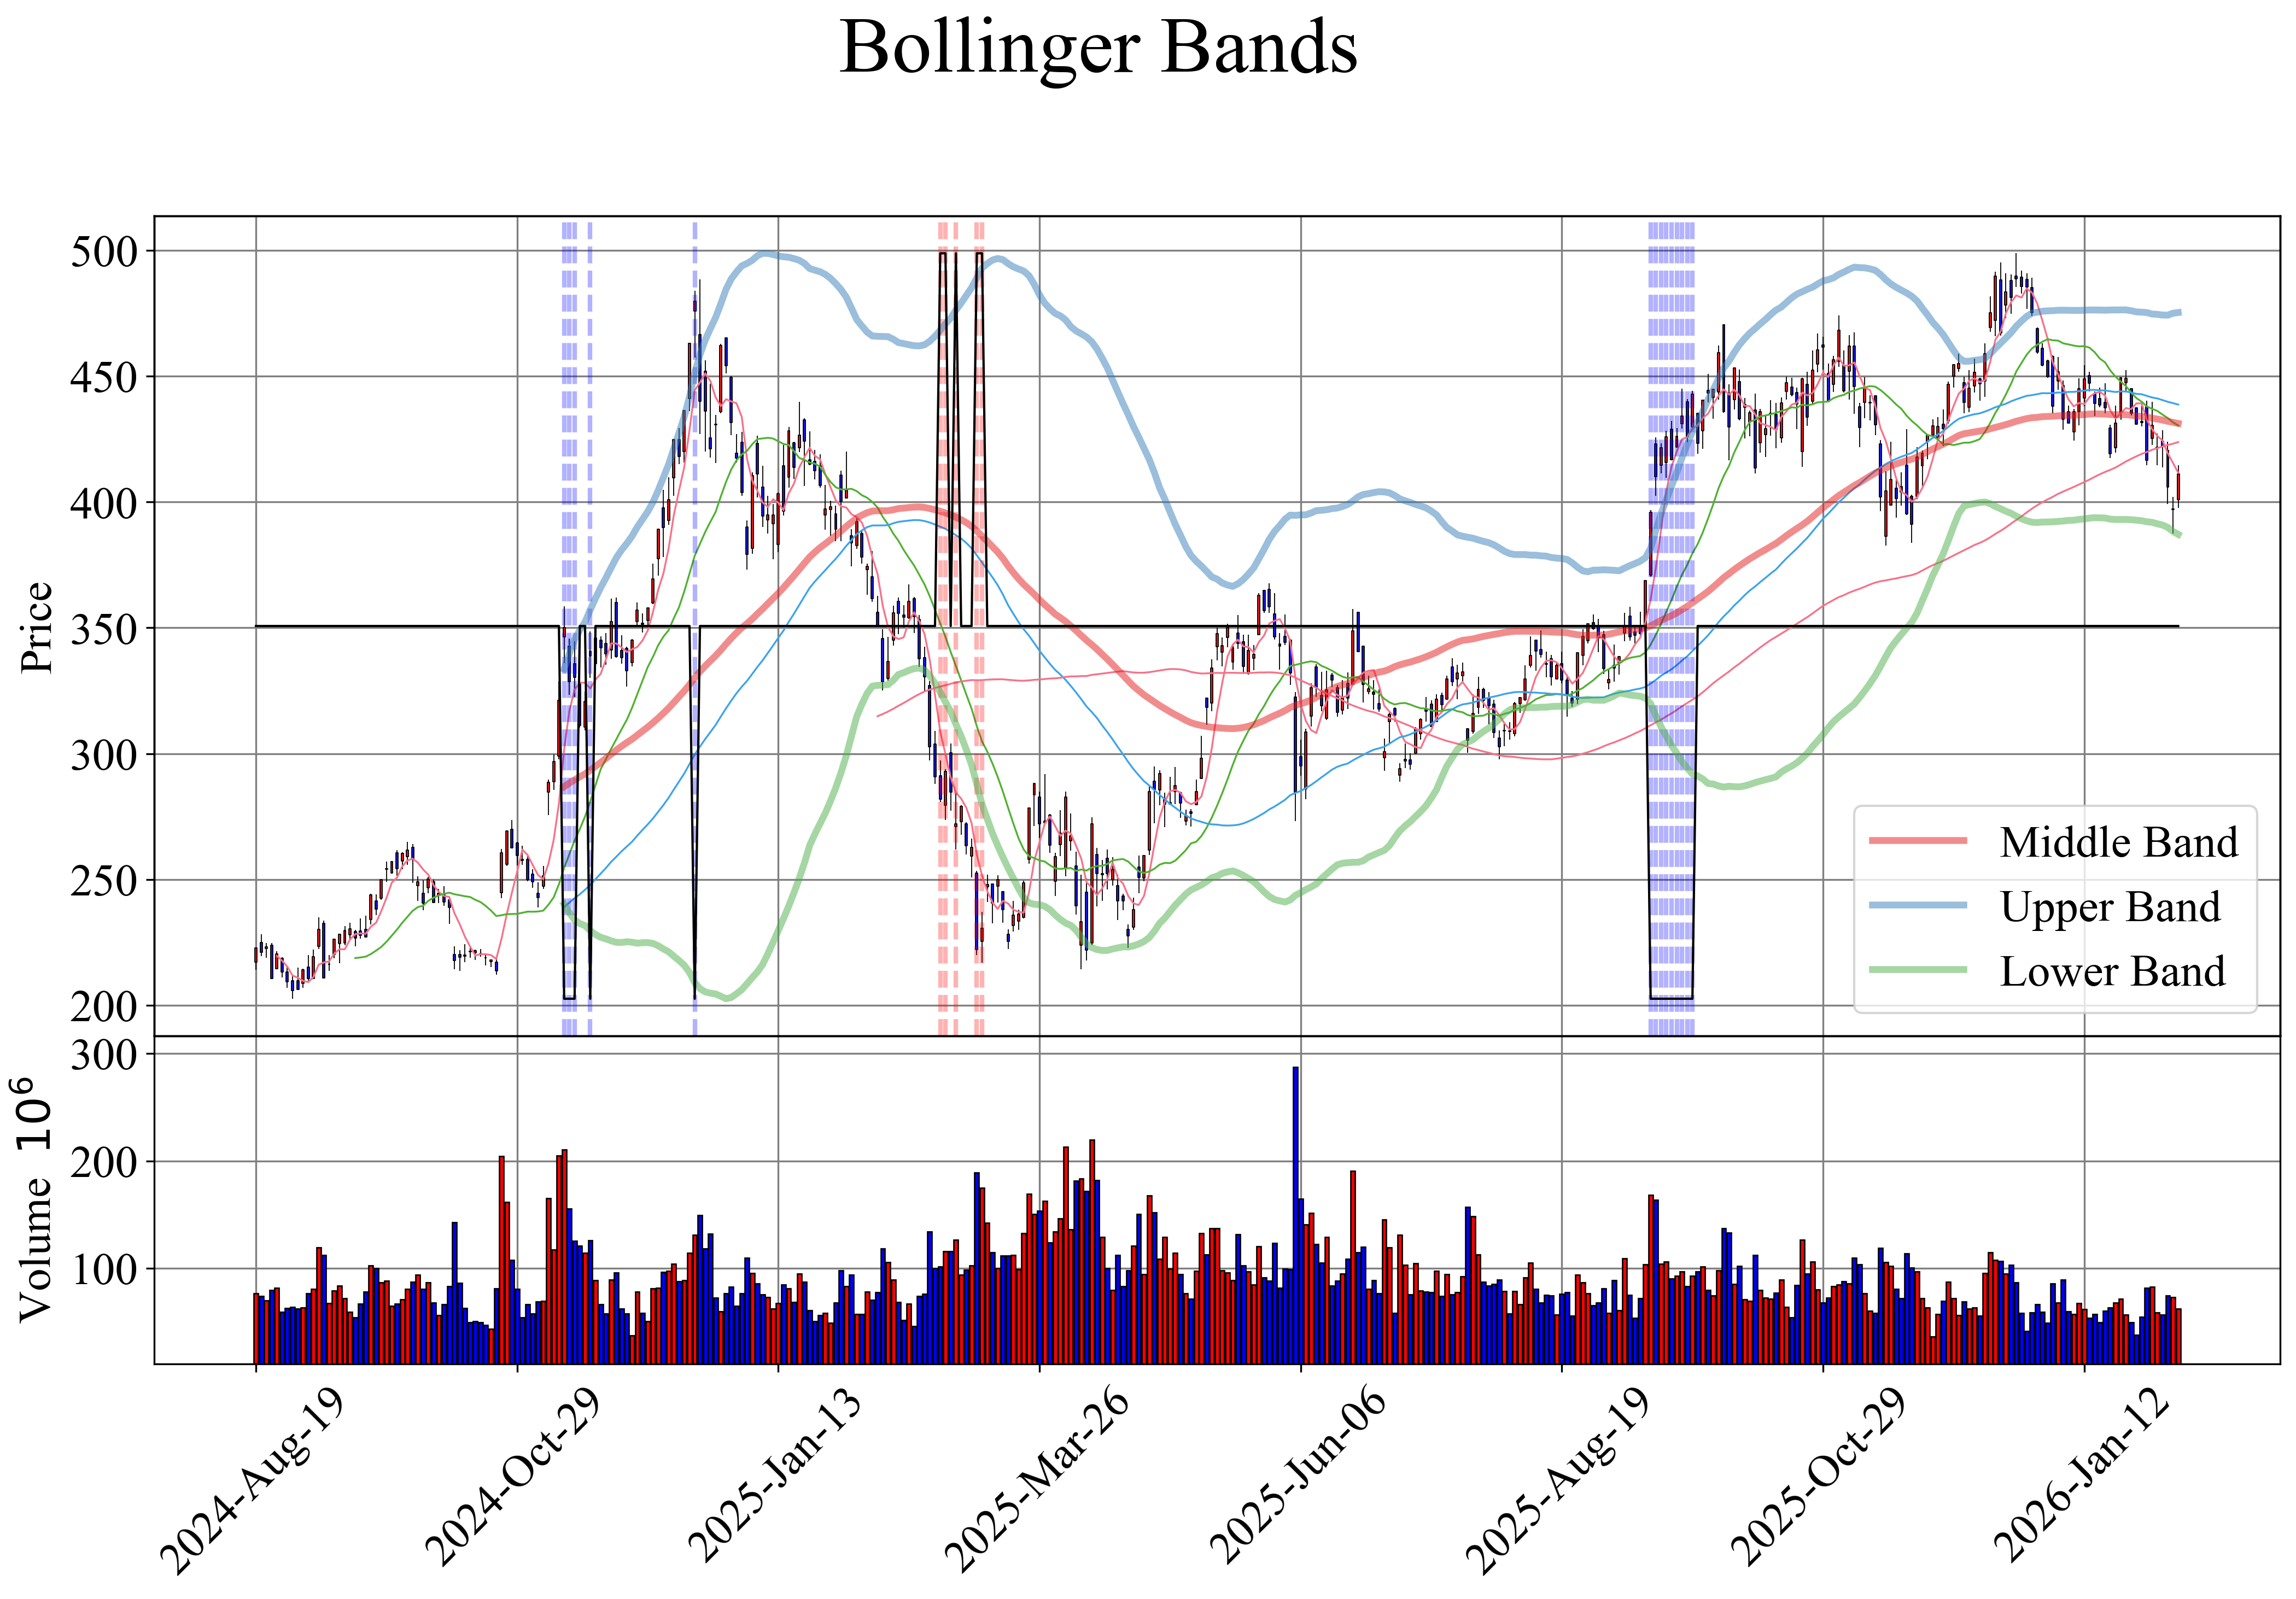
bollinger_bands(data: DataFrame, window: int = 60, num_std_dev: float = 2.5, ohlc: str = '') -> DataFrame
Bollinger band 기반 매수 및 매도 signal을 생성하는 function
Note
Bollinger Band
- Definition: 1980년대에 John Bollinger에 의해 개발된 가격 변동성 및 추세 파악 기법
- Mean
- Middle Band: 기본적인 중간 가격 추세
- Upper Band: Middle band에서 일정 표준편차 위에 위치 (과도한 상승 추세나 고평가 상태)
- Lower Band: Middle band에서 일정 표준편차 아래에 위치 (과도한 하락 추세나 저평가 상태)
- 매수 신호: 주가가 하단 Bollinger band (
lower_band) 아래로 감소할 때 생성 (과매도 상태) - 매도 신호: 주가가 상단 Bollinger band (
upper_band) 위로 상승할 때 생성 (과매수 상태)
Parameters:
| Name | Type | Description | Default |
|---|---|---|---|
data | DataFrame | OHLCV (Open, High, Low, Close, Volume) data | required |
window | int | 이동 평균을 계산하기 위한 widnow 크기 | 60 |
num_std_dev | float | 표준편차의 배수 | 2.5 |
ohlc | str | 이동 평균을 계산할 때 사용할 | '' |
Returns:
| Type | Description |
|---|---|
DataFrame | 각 날짜에 대한 signal ( |
Examples:
>>> zz.quant.bollinger_bands(data)
              middle_band     upper_band    lower_band  signals
Date
2022-01-03            NaN            NaN           NaN        0
...                   ...            ...           ...      ...
2023-12-19  102771.666667  111527.577705  94015.755629        0
[485 rows x 4 columns]
Source code in zerohertzLib/quant/methods.py
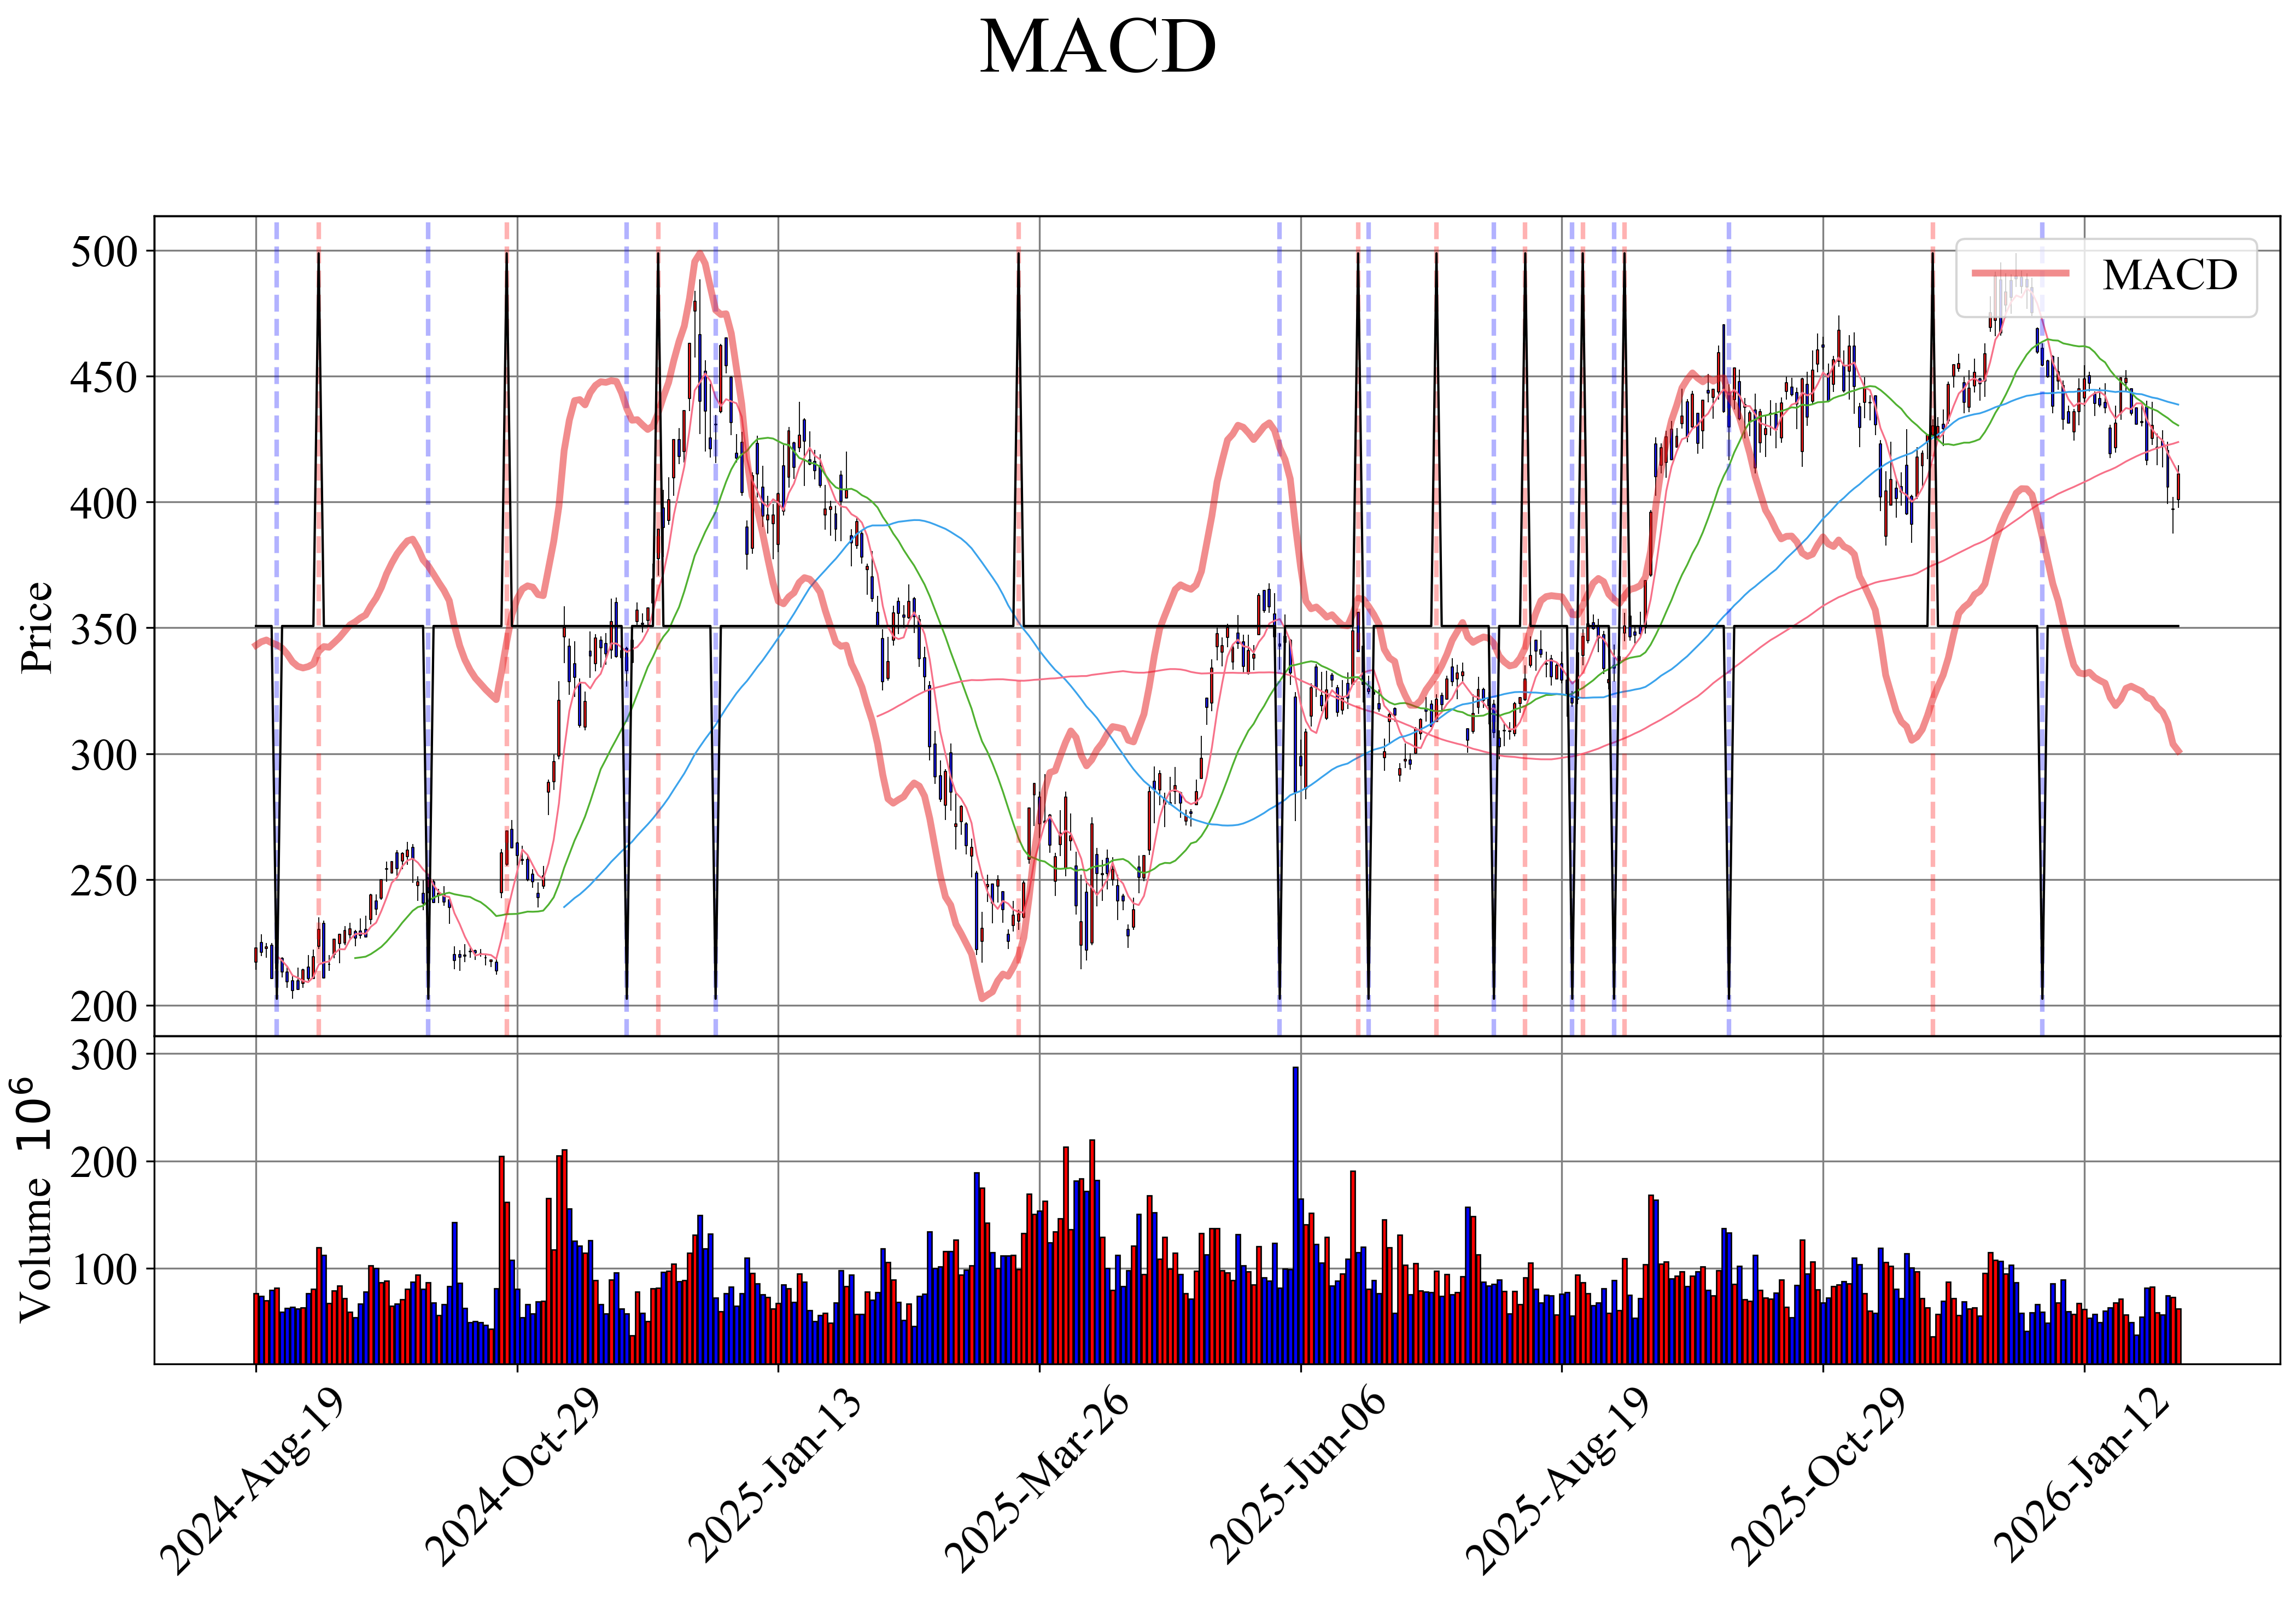
MACD 기반 매수 및 매도 signal을 생성하는 function
Note
MACD (Moving Average Convergence Divergence)
- Definition: 빠른 EMA (
n_fast)와 느린 EMA (n_slow)의 차이n_slow = n_fast * 2
- Mean
- EMA: 최근 가격에 더 많은 가중치를 두어 계산하는 이동 평균
- Signal line: MACD의 추세를 평활화하여 추세의 방향과 강도를 파악
- 매수 신호: MACD가 signal line 위로 상승할 때 생성 (상승 추세)
- 매도 신호: MACD가 signal line 아래로 하락할 때 생성 (하락 추세)
Parameters:
| Name | Type | Description | Default |
|---|---|---|---|
data | DataFrame | OHLCV (Open, High, Low, Close, Volume) data | required |
n_fast | int | 빠른 EMA 계산을 위한 기간 | 12 |
n_signal | int | MACD signal line 계산을 위한 기간 | 9 |
ohlc | str | Momentum을 계산할 때 사용할 | '' |
Returns:
| Type | Description |
|---|---|
DataFrame | 각 날짜에 대한 signal ( |
Examples:
>>> zz.quant.macd(data)
                   MACD  signals
Date
2022-01-03     0.000000        0
...                 ...      ...
2023-12-19 -1950.006134        0
[485 rows x 2 columns]
Source code in zerohertzLib/quant/methods.py
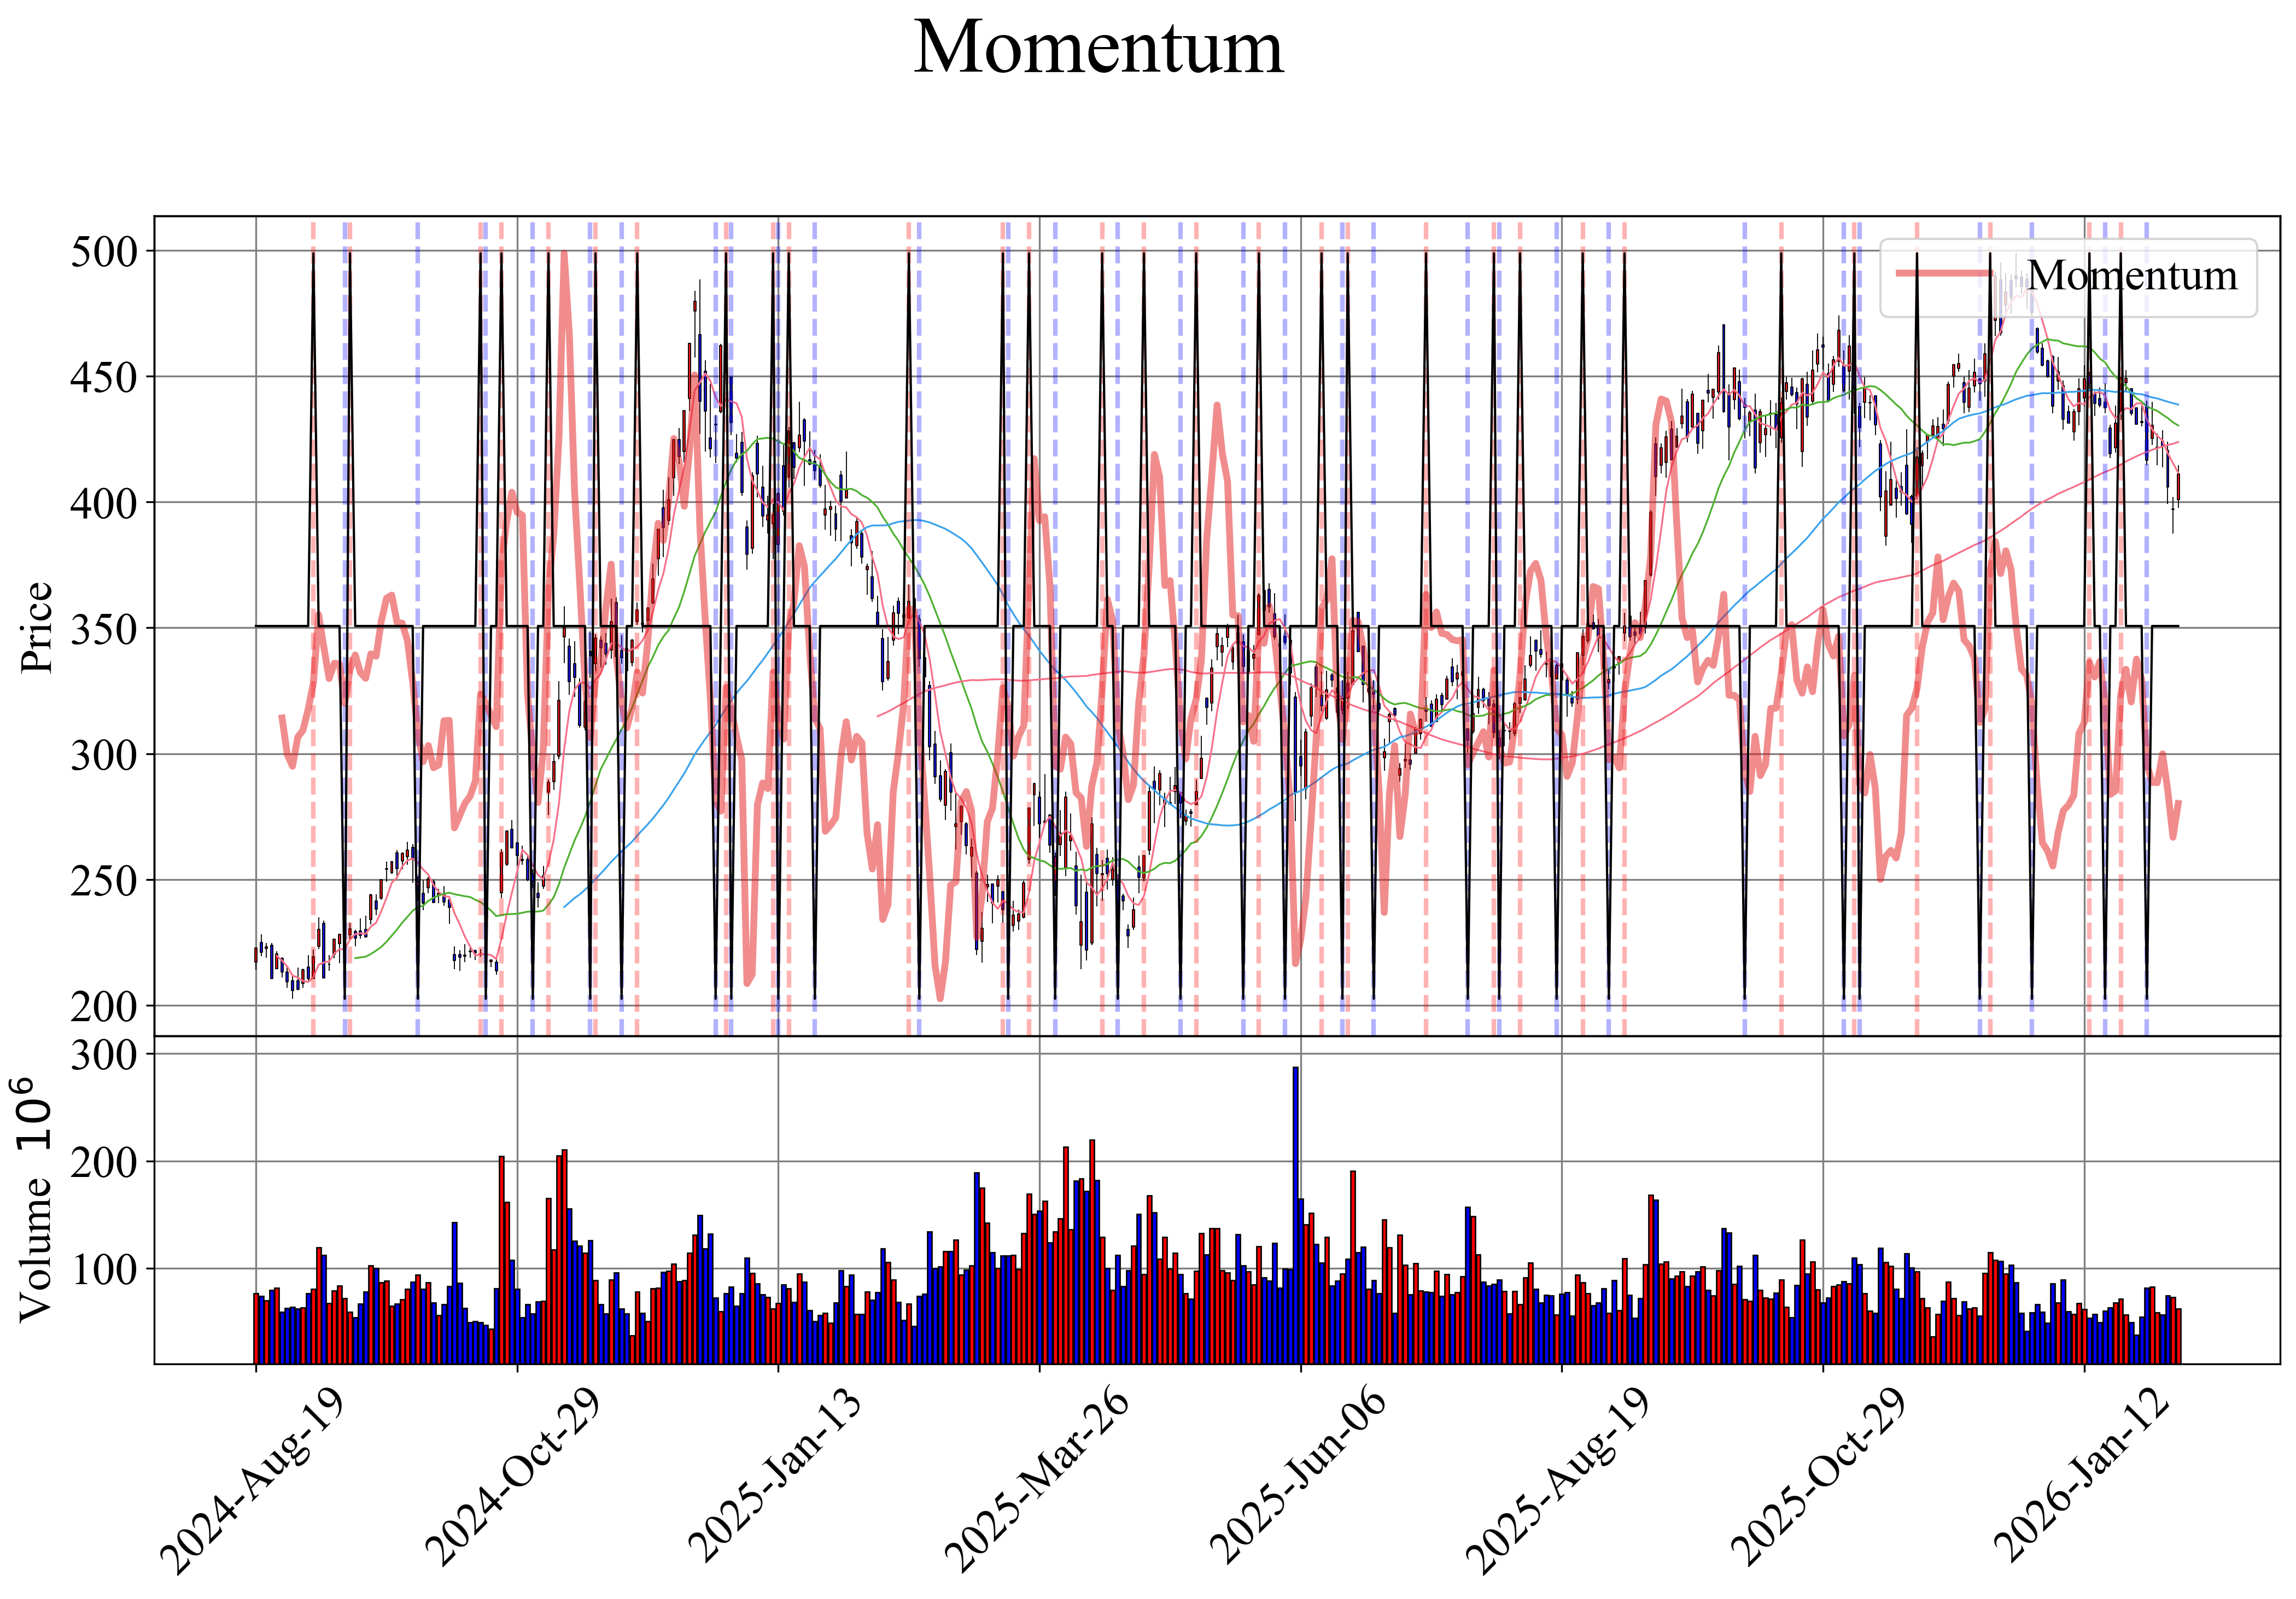
Momentum 기반 매수 및 매도 signal을 생성하는 function
Note
Momentum
- Definition:
data[ohlc].diff(window)를 통해window일 전 가격 사이의 차이 계산 - Mean
- 양의 momentum: 가격 상승
- 음의 momentum: 가격 하락
- Momentum의 크기: 추세의 강도
- 매수 신호: 주가 momentum이 양수일 때 생성 (상승 추세)
- 매도 신호: 주가 momentum이 음수일 때 생성 (하락 추세)
Parameters:
| Name | Type | Description | Default |
|---|---|---|---|
data | DataFrame | OHLCV (Open, High, Low, Close, Volume) data | required |
window | int | Momentum을 계산하기 위한 widnow 크기 | 5 |
ohlc | str | Momentum을 계산할 때 사용할 | '' |
Returns:
| Type | Description |
|---|---|
DataFrame | 각 날짜에 대한 signal ( |
Examples:
>>> zz.quant.momentum(data)
            momentum  signals
Date
2022-01-03       NaN        0
...              ...      ...
2023-12-19     550.0        0
[485 rows x 2 columns]
Source code in zerohertzLib/quant/methods.py
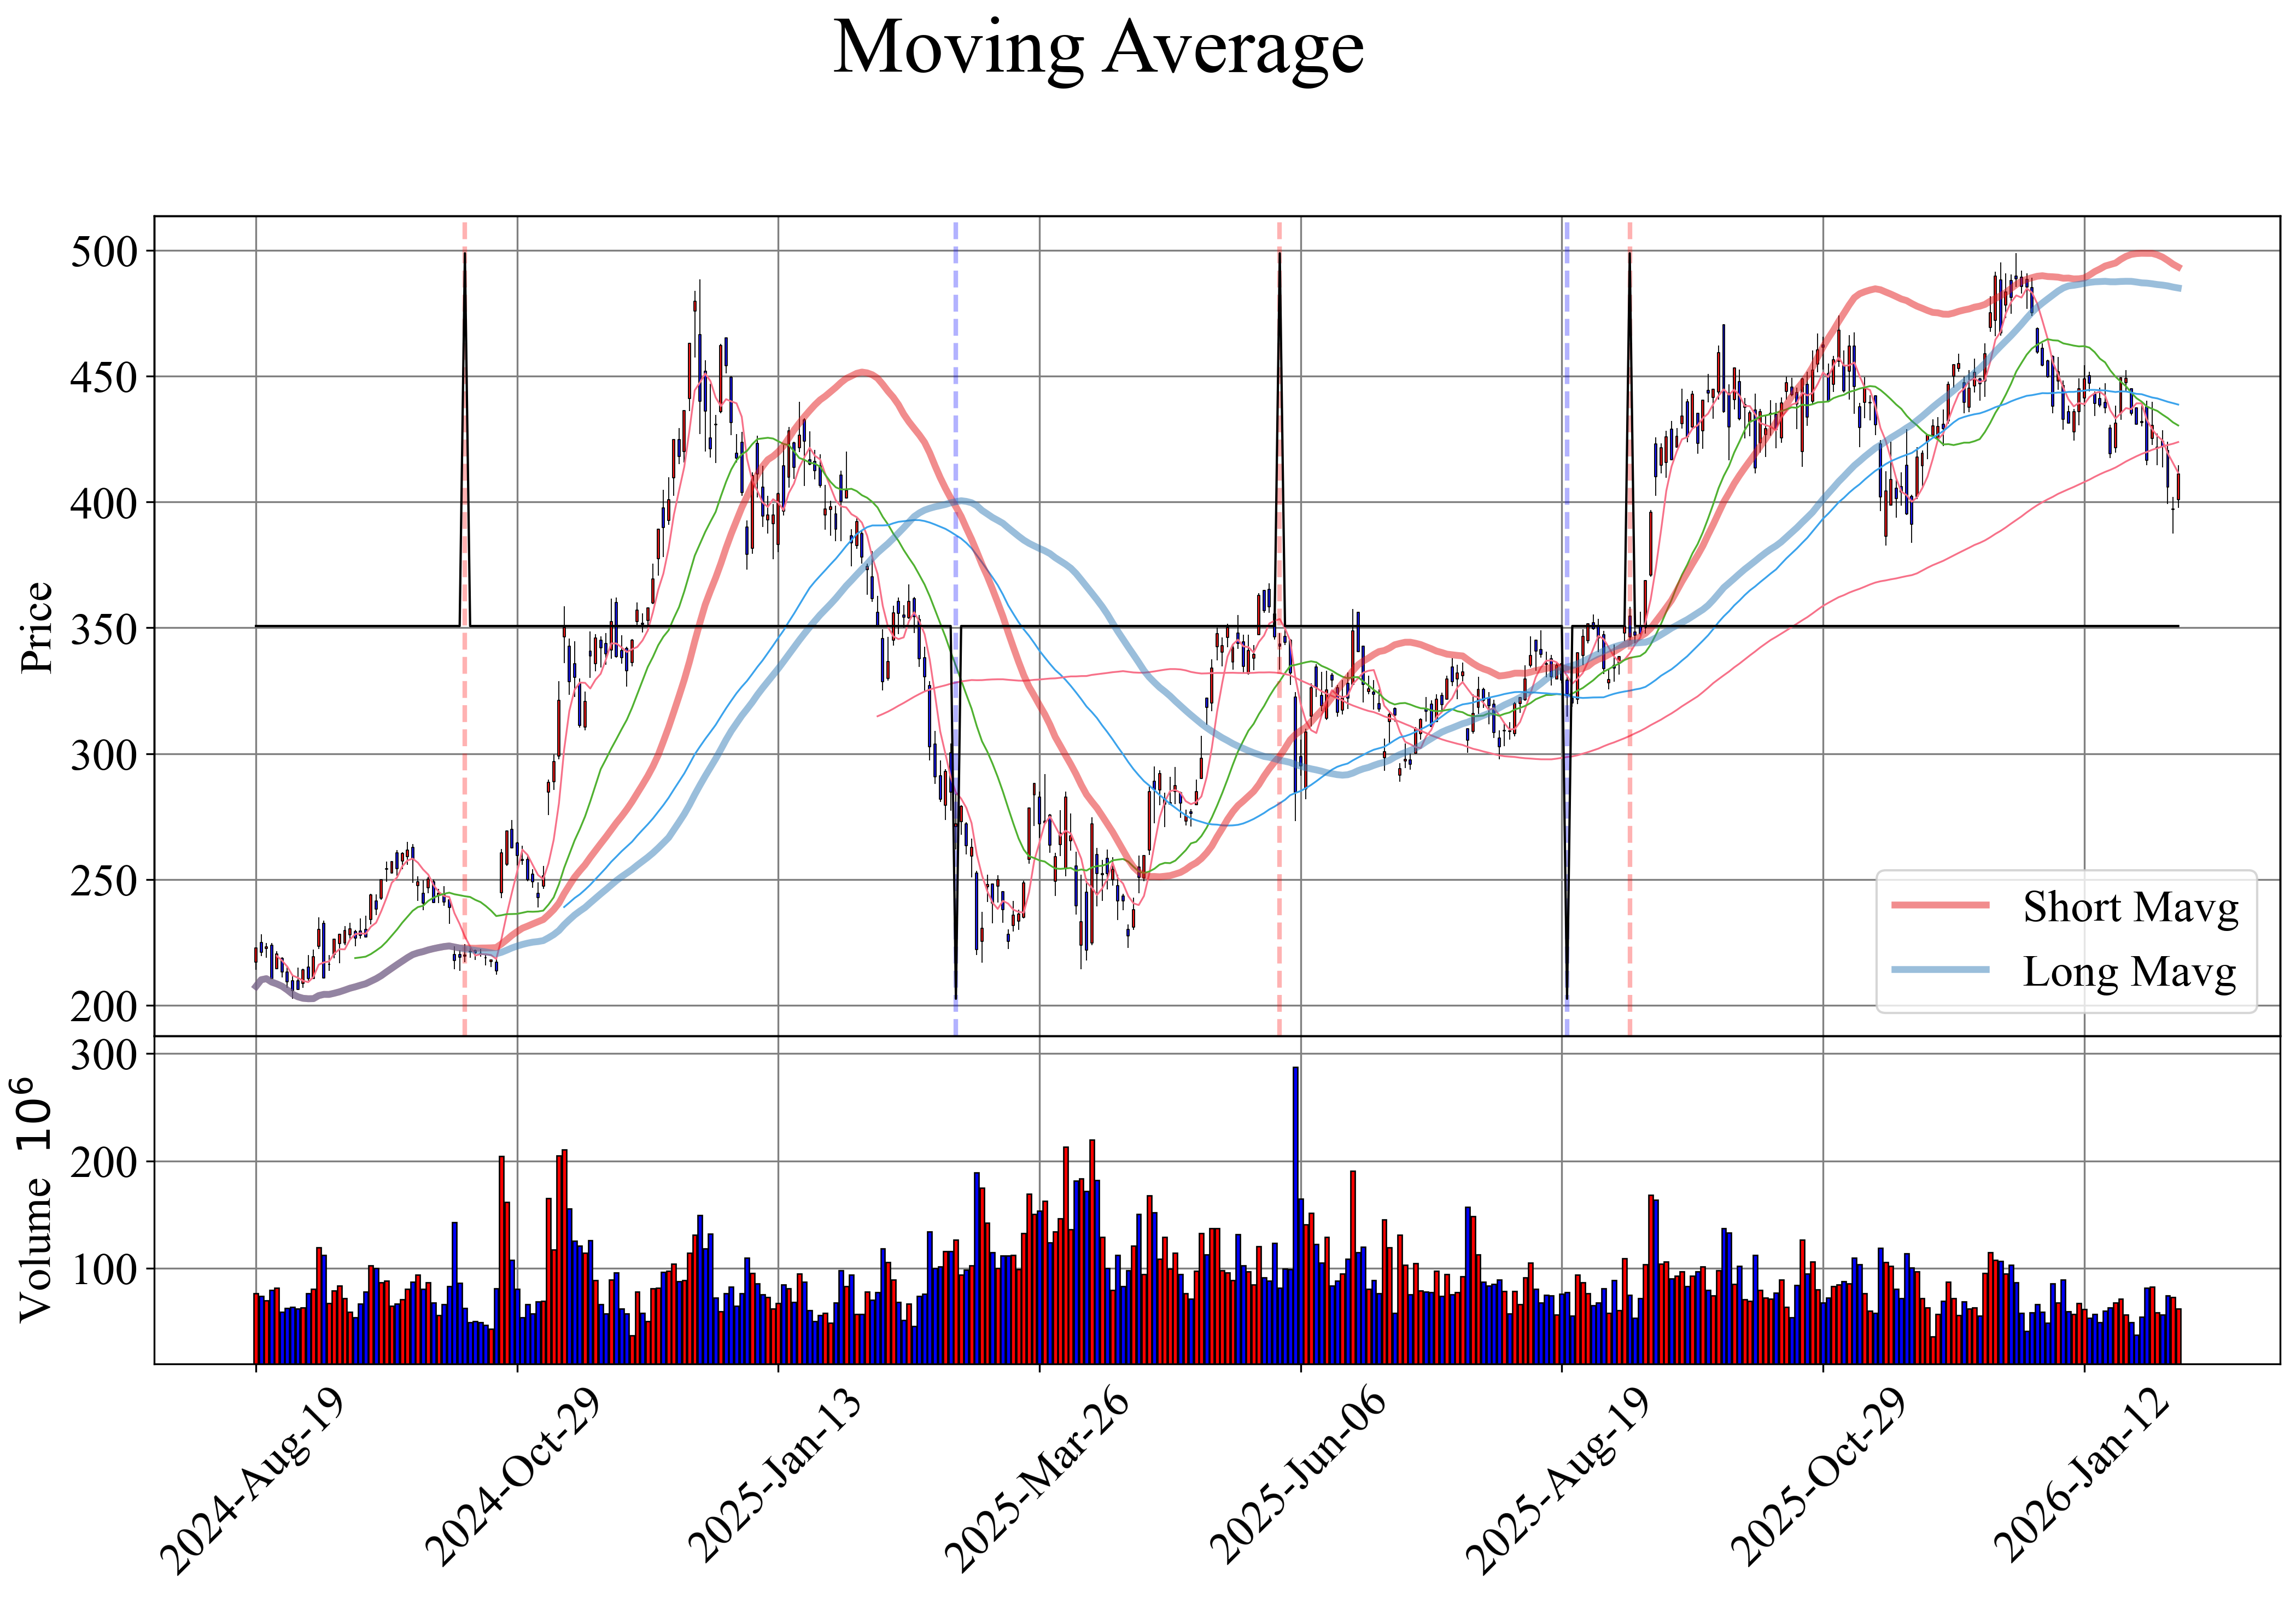
moving_average(data: DataFrame, short_window: int = 40, long_window: int = 80, threshold: float = 0.0, ohlc: str = '') -> DataFrame
단기 및 장기 이동 평균 기반 매수 및 매도 signal을 생성하는 function
Note
Moving Average
- Definition: 일정 기간 동안 평균화하여 추세 파악 및 noise 감소
- 매수 신호: 단기 이동 평균이 장기 이동 평균보다 높을 때 생성 (상승 추세)
- 매도 신호: 단기 이동 평균이 장기 이동 평균보다 낮을 때 생성 (하락 추세)
Parameters:
| Name | Type | Description | Default |
|---|---|---|---|
data | DataFrame | OHLCV (Open, High, Low, Close, Volume) data | required |
short_window | int | 단기 이동 평균을 계산하기 위한 window 크기 | 40 |
long_window | int | 장기 이동 평균을 계산하기 위한 widnow 크기 | 80 |
threshold | float | 신호를 발생 시킬 임계값 | 0.0 |
ohlc | str | 이동 평균을 계산할 때 사용할 | '' |
Returns:
| Type | Description |
|---|---|
DataFrame | 각 날짜에 대한 signal ( |
Examples:
>>> zz.quant.moving_average(data)
            short_mavg    long_mavg  signals
Date
2022-01-03  139375.000  139375.0000        0
...                ...          ...      ...
2023-12-19  102450.000  102337.1875        0
[485 rows x 3 columns]
Source code in zerohertzLib/quant/methods.py
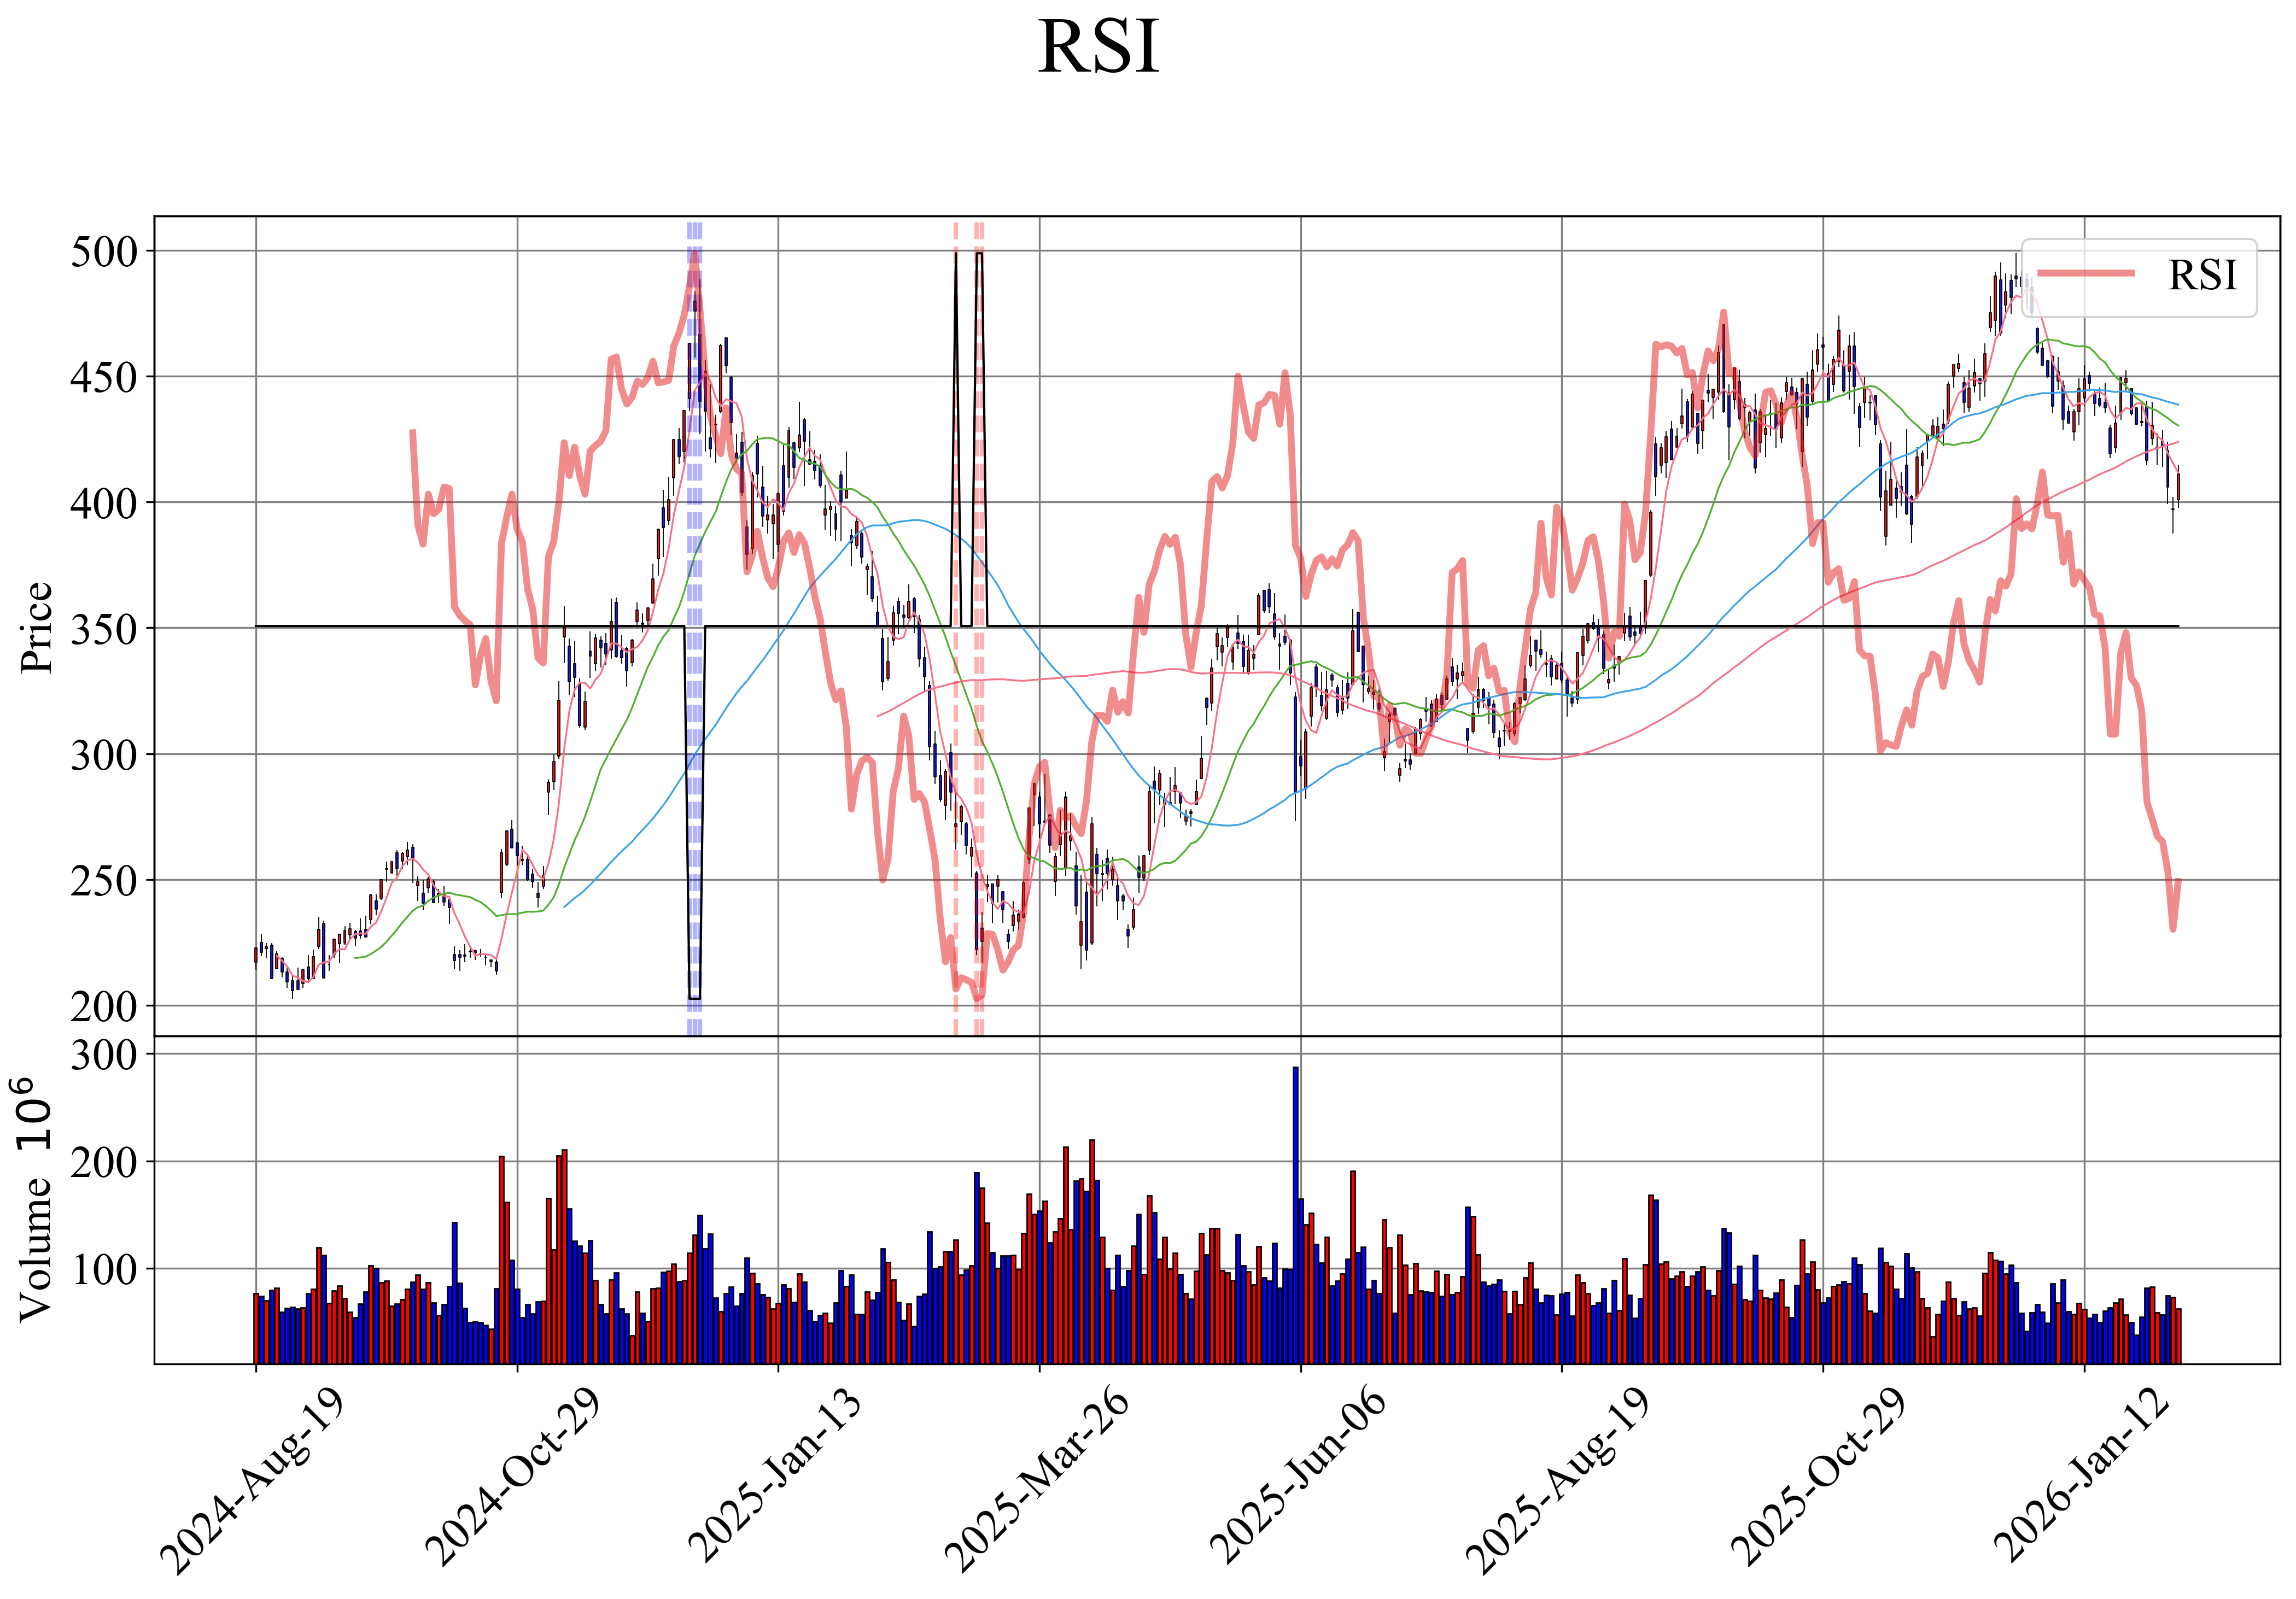
rsi(data: DataFrame, lower_bound: int = 20, upper_bound: int = 80, window: int = 30, ohlc: str = '') -> DataFrame
RSI 기반 매수 및 매도 signal을 생성하는 function
Note
RSI (Relative Strength Index)
-
Definition
- \(RS = \frac{Average\ Gain}{Average\ Loss}\)
- \(RSI = 100 - \frac{100}{1+RS}\)
-
Mean
-1→0: 과매수 상태에서 중립 상태로 변화 (매도 position 청산)0→-1: 과매수 상태로의 진입 (새로운 매도 position)+1→0: 과매도 상태에서 중립 상태로 변화 (매수 position 청산)0→+1: 과매도 상태로의 진입 (새로운 매수 position)
- 매수 신호: RSI 값이
lower_bound보다 낮을 때 생성 (과매도 상태) - 매도 신호: RSI 값이
upper_bound보다 높을 때 생성 (과매수 상태)
Parameters:
| Name | Type | Description | Default |
|---|---|---|---|
data | DataFrame | OHLCV (Open, High, Low, Close, Volume) data | required |
lower_bound | int | RSI 과매도 기준 | 20 |
upper_bound | int | RSI 과매수 기준 | 80 |
window | int | 이동 평균을 계산하기 위한 widnow 크기 | 30 |
ohlc | str | RSI를 계산할 때 사용할 | '' |
Returns:
| Type | Description |
|---|---|
DataFrame | 각 날짜에 대한 signal ( |
Examples:
>>> zz.quant.rsi(data)
                  RSI  signals
Date
2022-01-03        NaN        0
...               ...      ...
2023-12-19  35.671343        0
[485 rows x 2 columns]