Functions:
| Name | Description |
|---|---|
scatter | Dictionary로 입력받은 data를 scatter plot으로 시각화 |
scatter(xdata: list[int | float] | dict[str, int | float], ydata: list[int | float] | dict[str, int | float], xlab: str | None = None, ylab: str | None = None, xlim: list[int | float] | None = None, ylim: list[int | float] | None = None, ncol: int = 1, title: str = 'tmp', colors: str | list | None = None, markersize: int = 36, figsize: tuple[int, int] = (15, 10), dpi: int = 300) -> str | None
Dictionary로 입력받은 data를 scatter plot으로 시각화
Parameters:
| Name | Type | Description | Default |
|---|---|---|---|
xdata | list[int | float] | dict[str, int | float] | 입력 data (X축) | required |
ydata | list[int | float] | dict[str, int | float] | 입력 data (Y축) | required |
xlab | str | None | Graph에 출력될 X축 label | None |
ylab | str | None | Graph에 출력될 Y축 label | None |
xlim | list[int | float] | None | Graph에 출력될 X축 limit | None |
ylim | list[int | float] | None | Graph에 출력될 Y축 limit | None |
ncol | int | Graph에 표시될 legend 열의 수 | 1 |
title | str | Graph에 표시될 제목 및 file 이름 | 'tmp' |
colors | str | list | None | 각 요소의 색 | None |
markersize | int | Graph에 출력될 marker의 크기 | 36 |
figsize | tuple[int, int] | Graph의 가로, 세로 길이 | (15, 10) |
dpi | int | Graph 저장 시 DPI (Dots Per Inch) | 300 |
Returns:
| Type | Description |
|---|---|
str | None | 저장된 graph의 절대 경로 |
Examples:
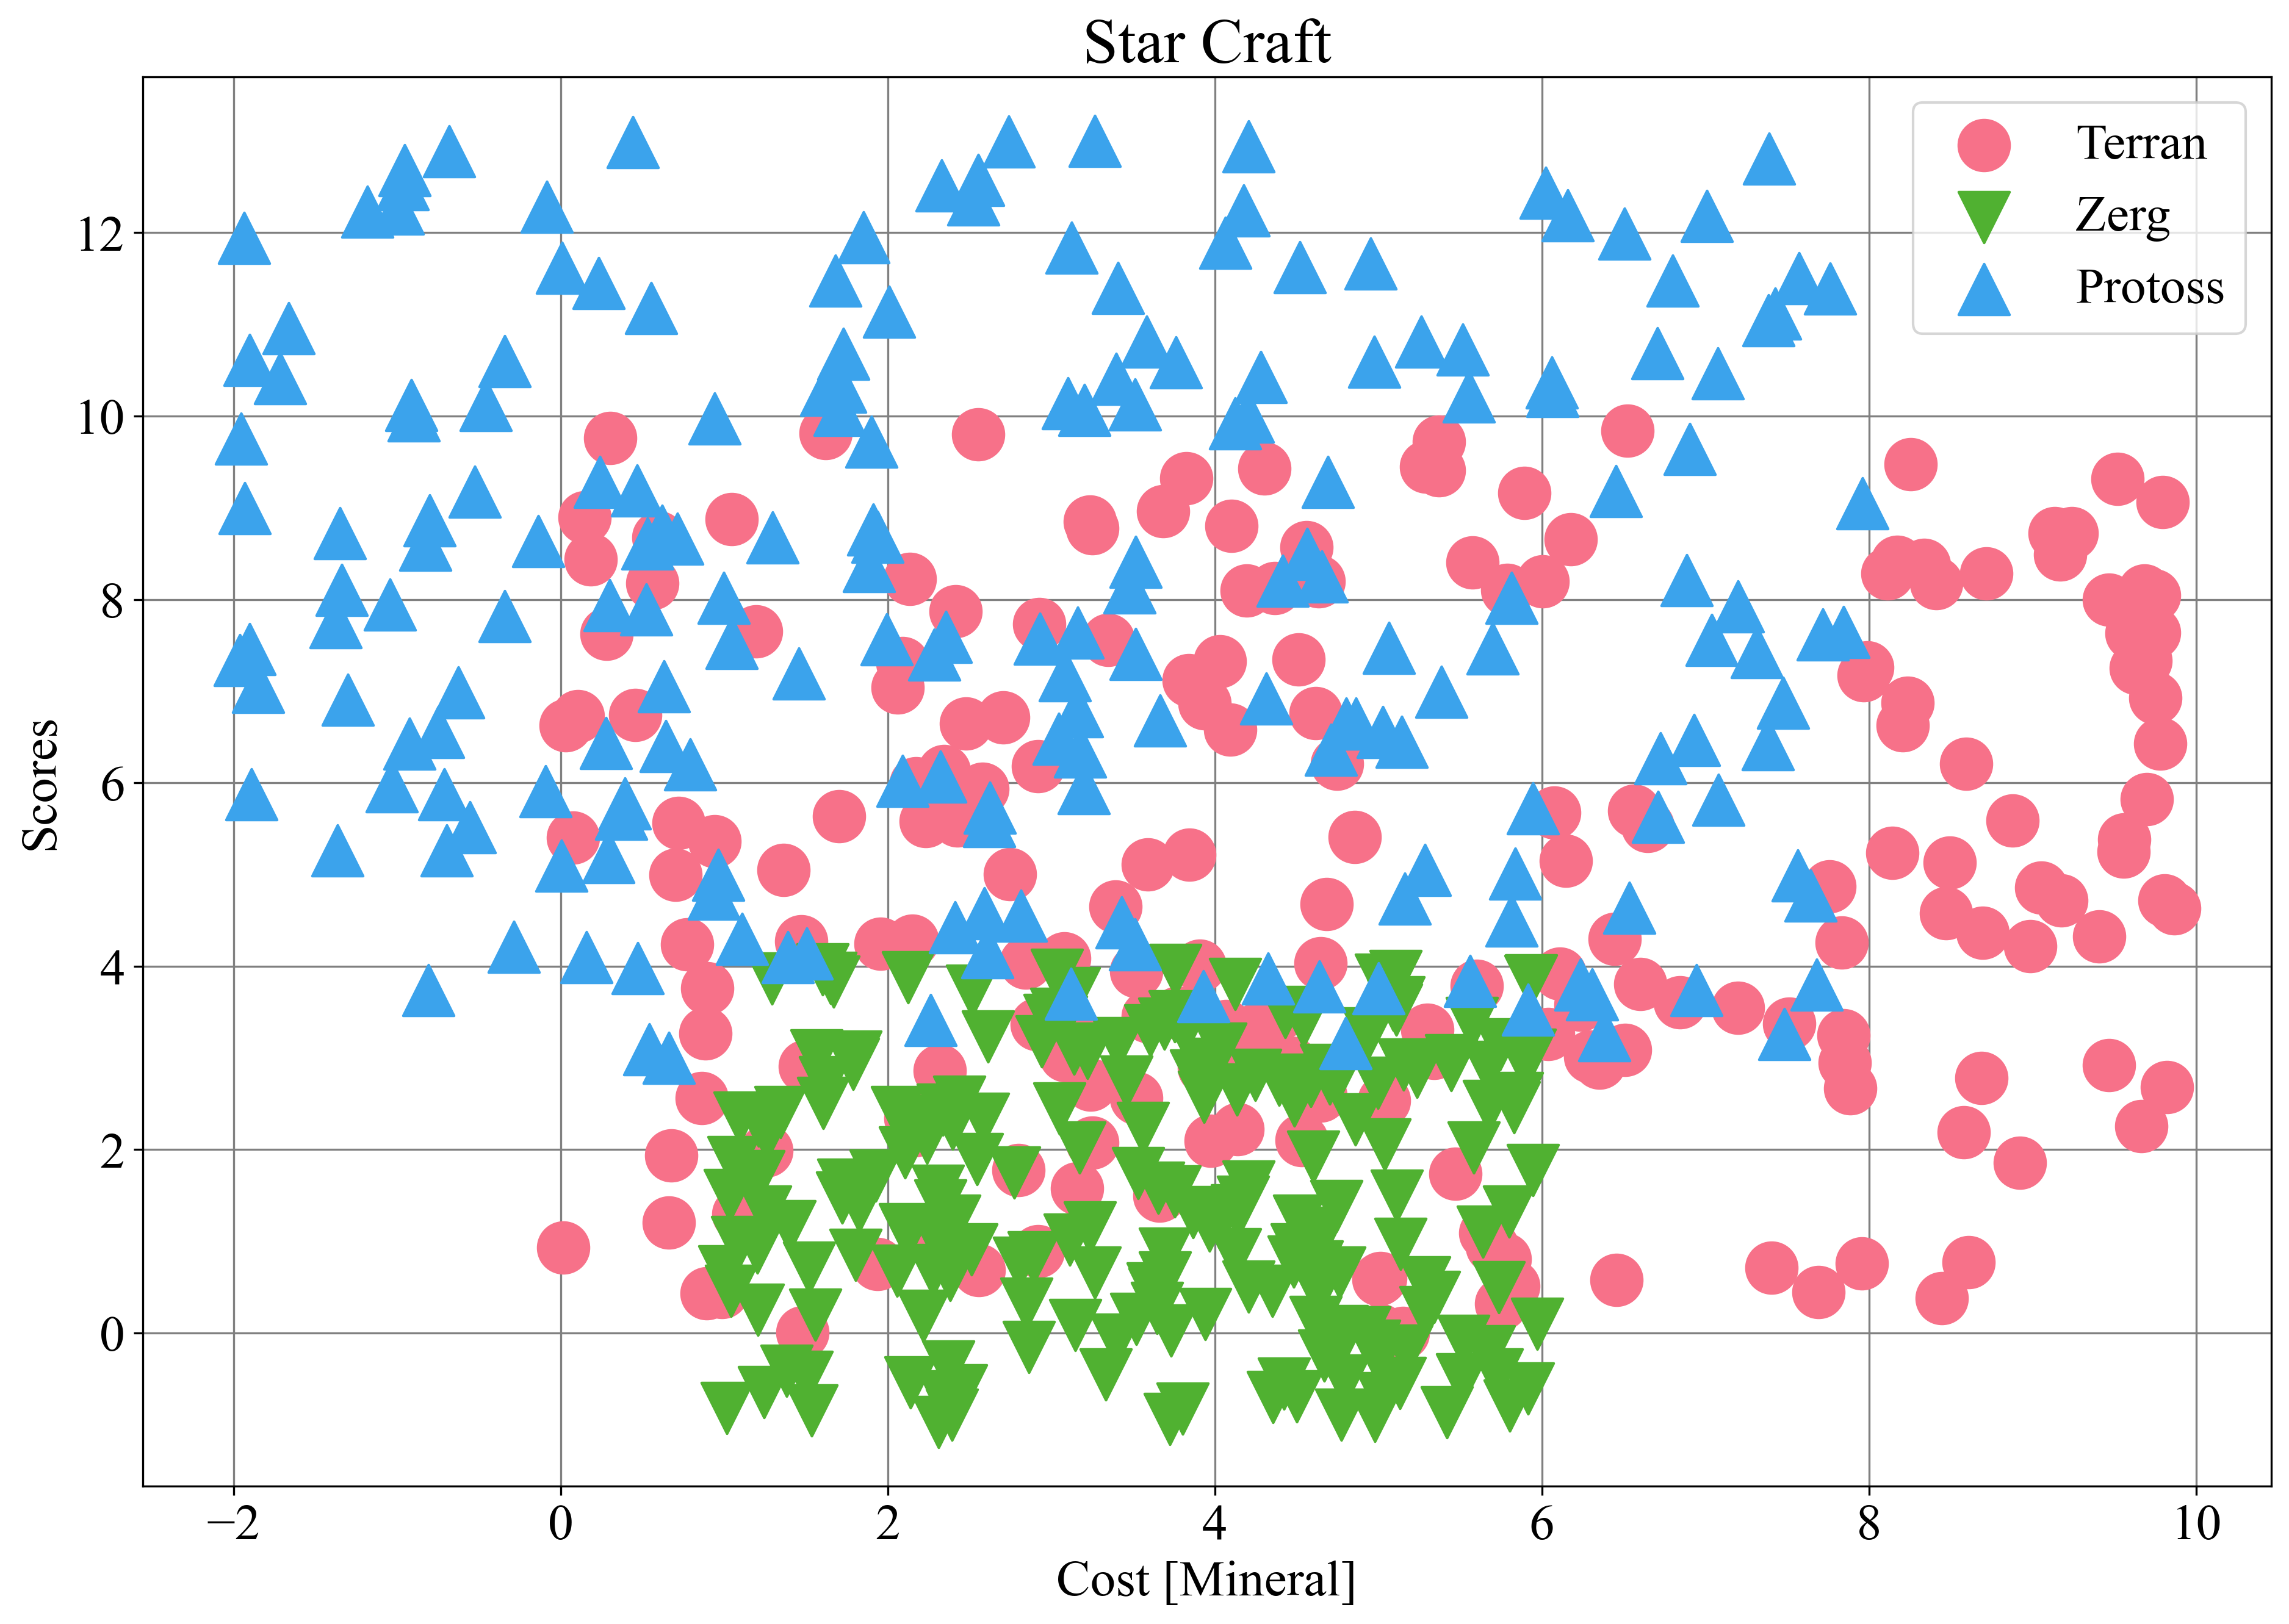
>>> xdata = {"Terran": [list(np.random.rand(200) * 10)], "Zerg": [list(np.random.rand(200) * 5 + 1)], "Protoss": [list(np.random.rand(200) * 10 - 2)]}
>>> ydata = {"Terran": [list(np.random.rand(200) * 10)], "Zerg": [list(np.random.rand(200) * 5 - 1)], "Protoss": [list(np.random.rand(200) * 10 + 3)]}
>>> zz.plot.scatter(xdata, ydata, xlab="Cost [Mineral]", ylab="Scores", title="Star Craft", markersize=400)