Functions:
| Name | Description |
|---|---|
pie | Dictionary로 입력받은 data를 pie chart로 시각화 |
pie(data: dict[str, int | float], dim: str | None = None, title: str = 'tmp', colors: str | list | None = None, figsize: tuple[int, int] = (15, 10), int_label: bool = True, dpi: int = 300) -> str | None
Dictionary로 입력받은 data를 pie chart로 시각화
Parameters:
| Name | Type | Description | Default |
|---|---|---|---|
data | dict[str, int | float] | 입력 data | required |
dim | str | None | 입력 | None |
title | str | Graph에 표시될 제목 및 file 이름 | 'tmp' |
colors | str | list | None | 각 요소의 색 | None |
figsize | tuple[int, int] | Graph의 가로, 세로 길이 | (15, 10) |
int_label | bool | Label 내 수치의 소수점 표기 여부 | True |
dpi | int | Graph 저장 시 DPI (Dots Per Inch) | 300 |
Returns:
| Type | Description |
|---|---|
str | None | 저장된 graph의 절대 경로 |
Examples:
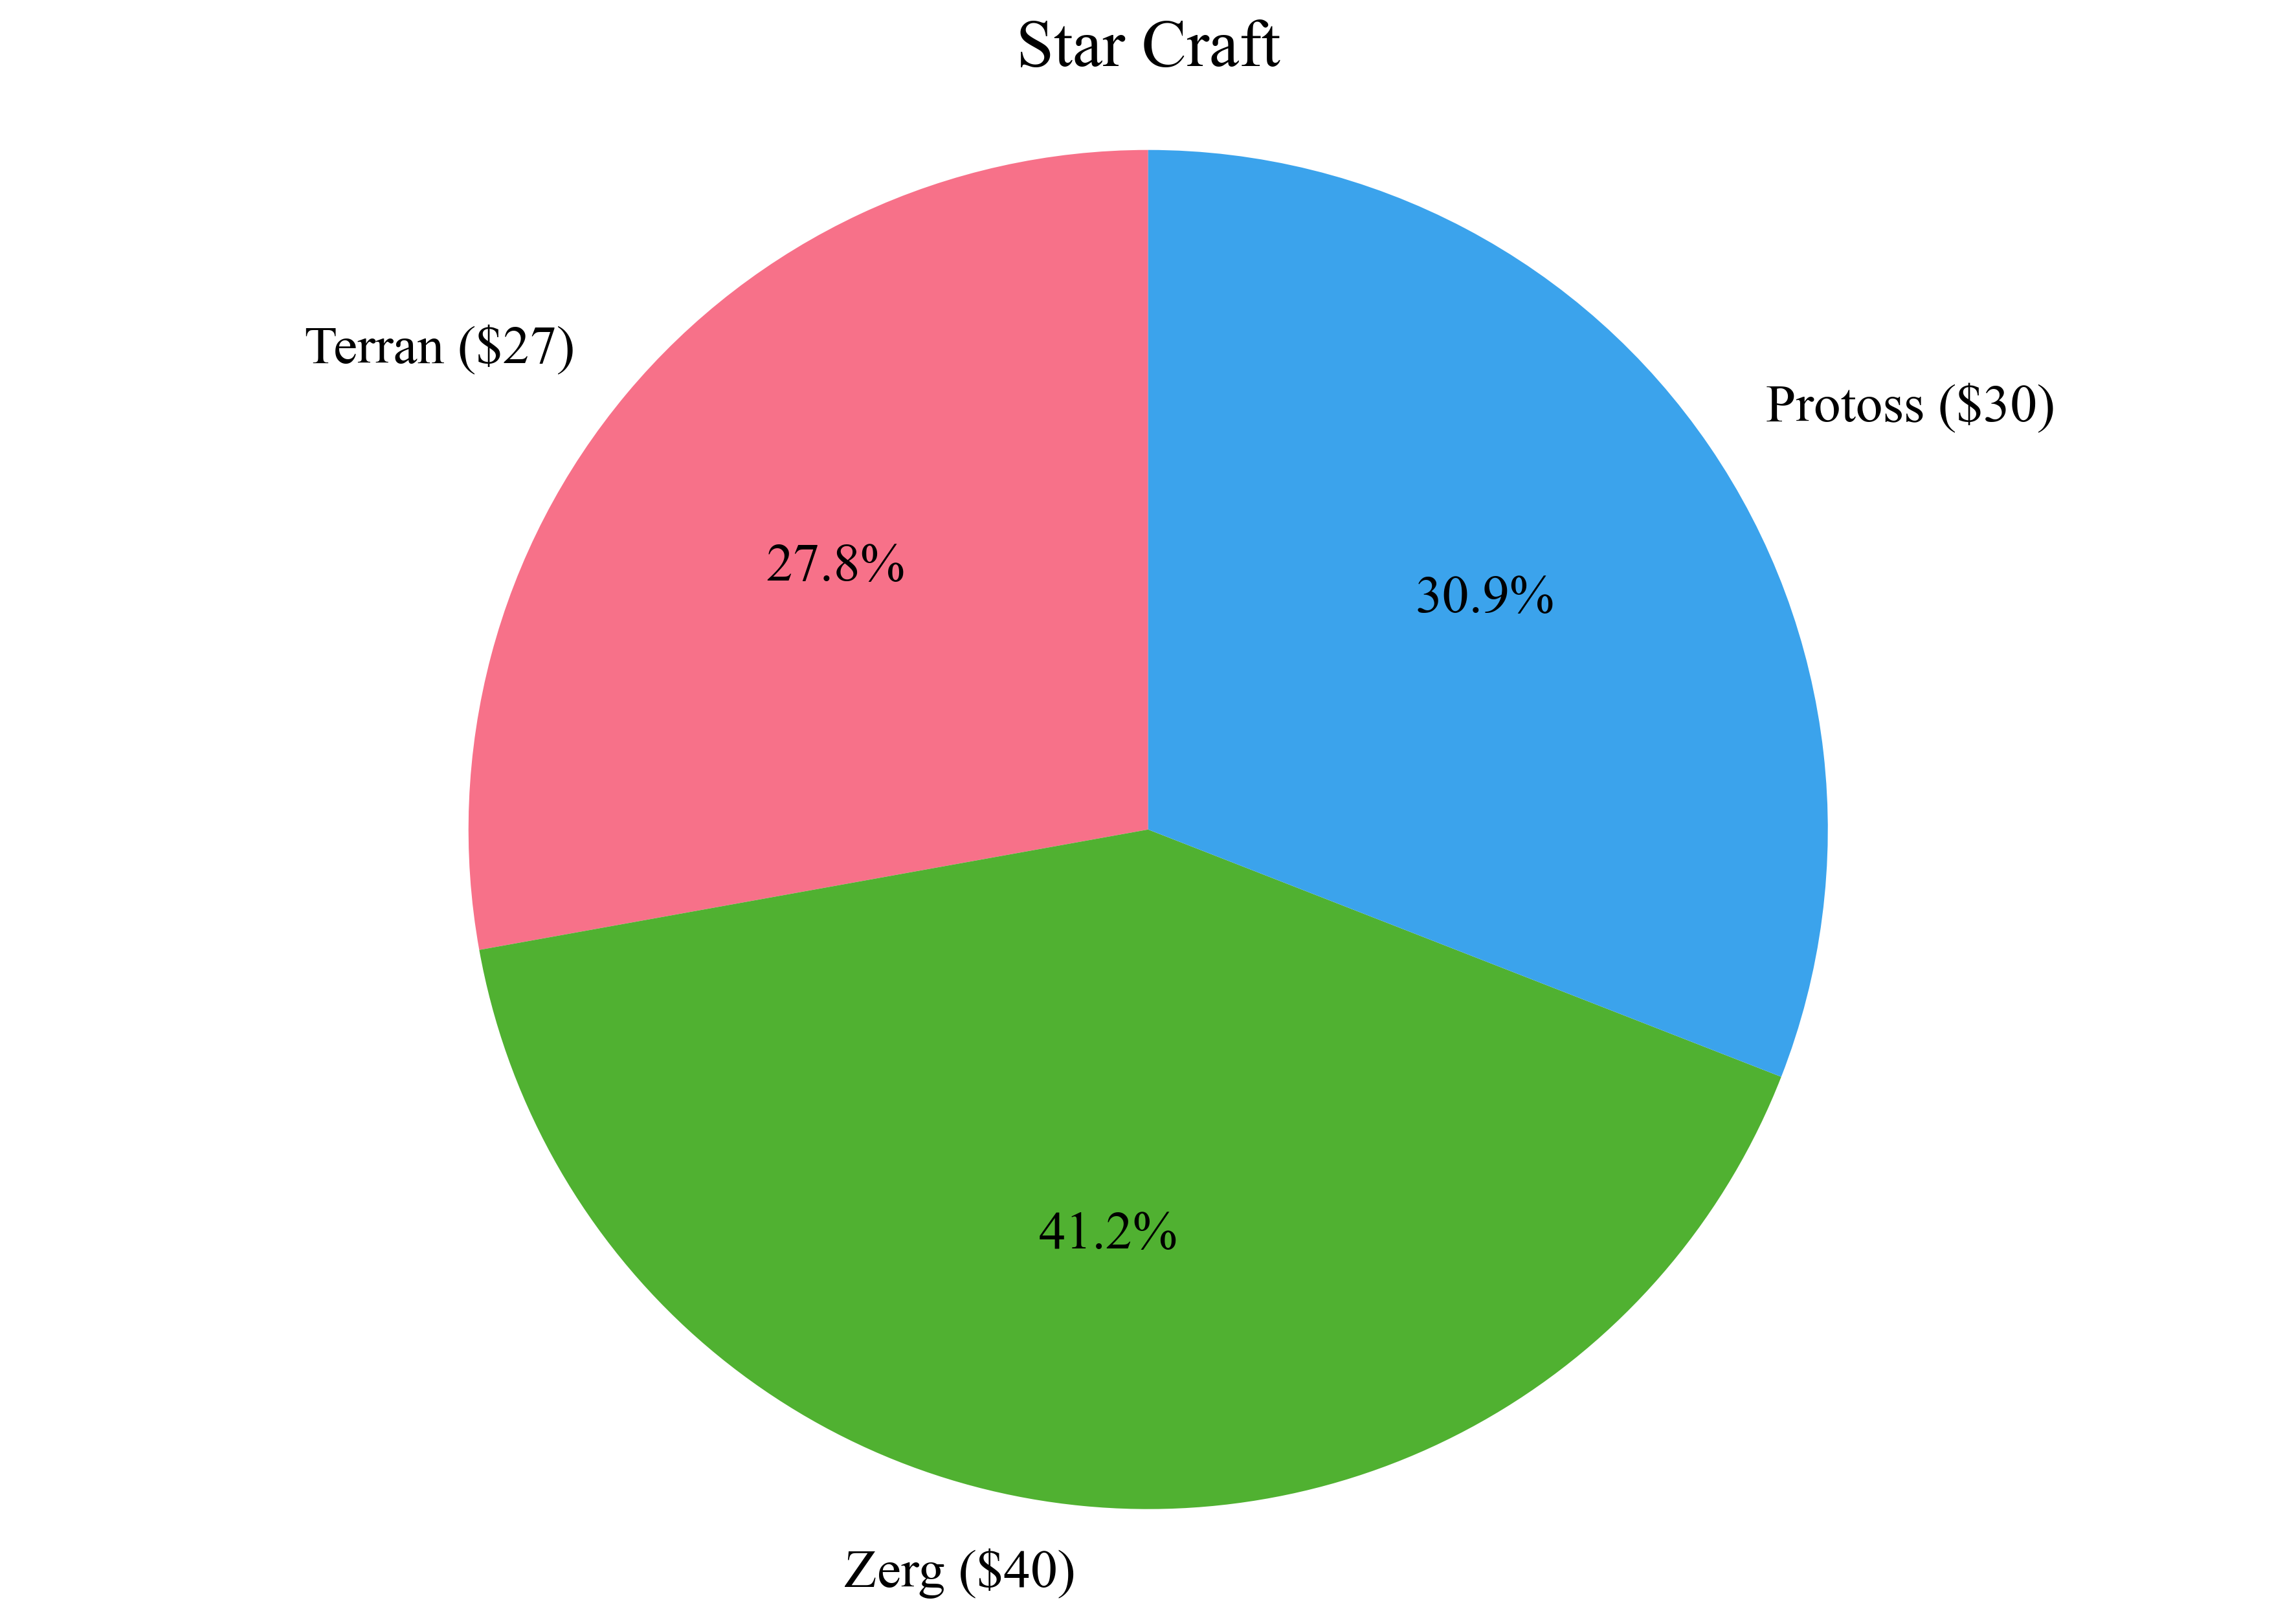
>>> data = {"Terran": 27, "Zerg": 40, "Protoss": 30}
>>> zz.plot.pie(data, dim="$", title="Star Craft")