Functions:
| Name | Description |
|---|---|
gpu_memory | 시간에 따른 GPU의 memory 사용량을 각 GPU에 따라 line chart로 시각화 |
gpu_usages | 시간에 따른 GPU의 사용량을 각 GPU에 따라 line chart로 시각화 |
각 GPU의 memory 사용량과 전체 용량을 조회하는 helper function
Returns:
| Type | Description |
|---|---|
list[tuple[float, float]] | 각 GPU의 (사용량, 전체용량) tuple 리스트 |
Source code in zerohertzLib/monitoring/gpu.py
각 GPU의 사용량을 조회하는 helper function
Returns:
| Type | Description |
|---|---|
list[float] | 각 GPU의 사용량 리스트 |
Source code in zerohertzLib/monitoring/gpu.py
gpu_memory(tick: int = 1, threshold: int = 10, grep: list[int] | None = None, path: str = 'GPU Memory', dpi: int = 100) -> None
시간에 따른 GPU의 memory 사용량을 각 GPU에 따라 line chart로 시각화
Parameters:
| Name | Type | Description | Default |
|---|---|---|---|
tick | int | Update 주기 | 1 |
threshold | int | 시각화할 총 시간 | 10 |
grep | list[int] | None | 시각화할 GPU의 번호 | None |
path | str | Graph를 저장할 경로 | 'GPU Memory' |
dpi | int | Graph 저장 시 DPI (Dots Per Inch) | 100 |
Returns:
| Type | Description |
|---|---|
None | 지정한 경로에 바로 graph 저장 |
Examples:
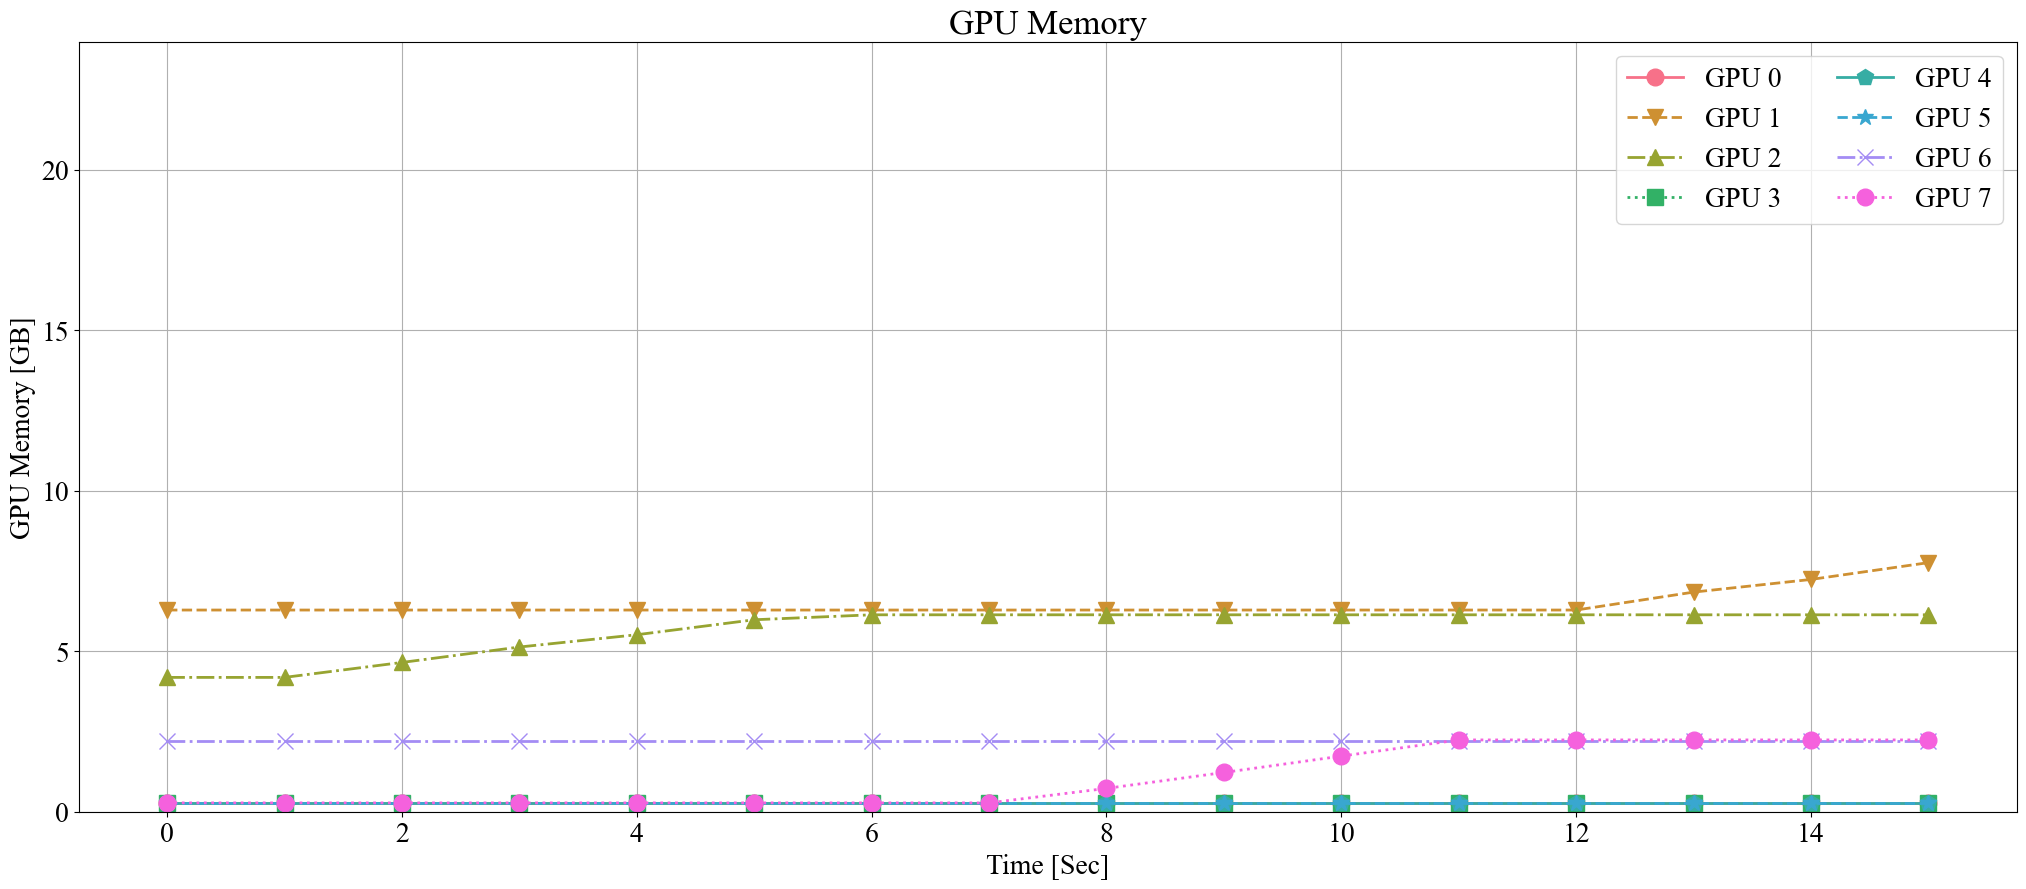
Source code in zerohertzLib/monitoring/gpu.py
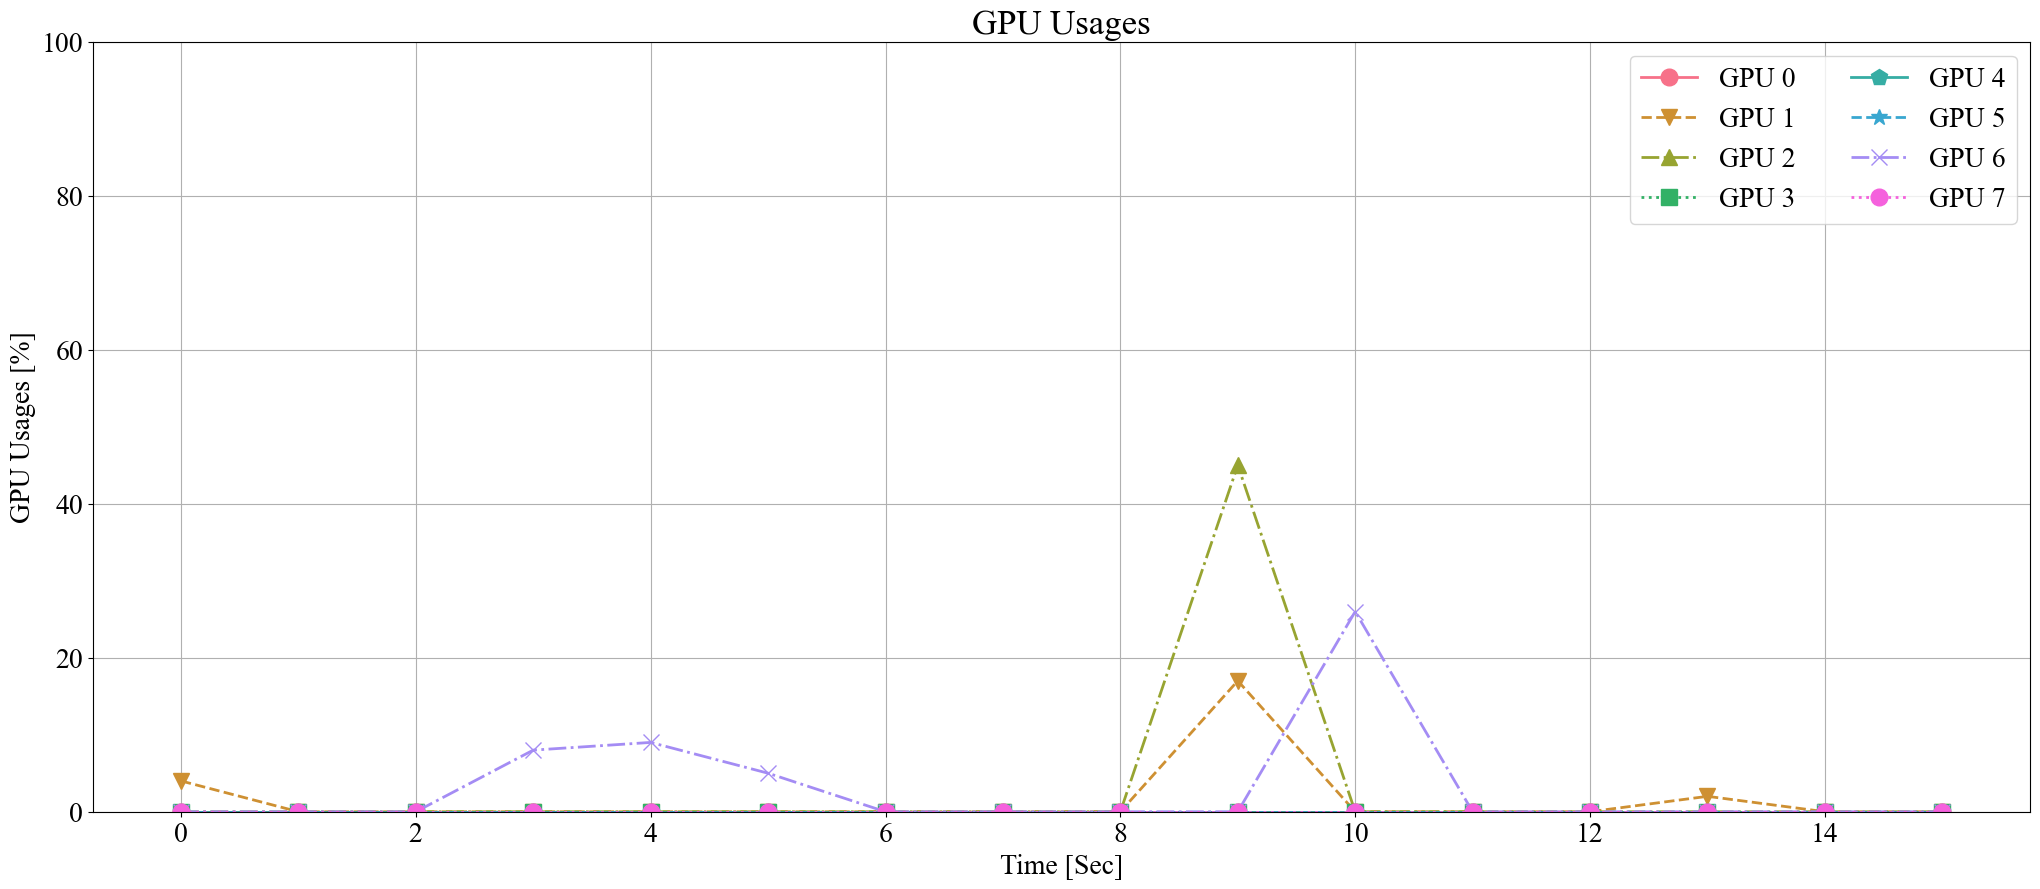
gpu_usages(tick: int = 1, threshold: int = 10, grep: list[int] | None = None, path: str = 'GPU Usages', dpi: int = 100) -> None
시간에 따른 GPU의 사용량을 각 GPU에 따라 line chart로 시각화
Parameters:
| Name | Type | Description | Default |
|---|---|---|---|
tick | int | Update 주기 | 1 |
threshold | int | 시각화할 총 시간 | 10 |
grep | list[int] | None | 시각화할 GPU의 번호 | None |
path | str | Graph를 저장할 경로 | 'GPU Usages' |
dpi | int | Graph 저장 시 DPI (Dots Per Inch) | 100 |
Returns:
| Type | Description |
|---|---|
None | 지정한 경로에 바로 graph 저장 |
Examples: