cpu(tick: int = 1, threshold: int = 10, path: str = 'CPU', dpi: int = 100, per: bool = True) -> None
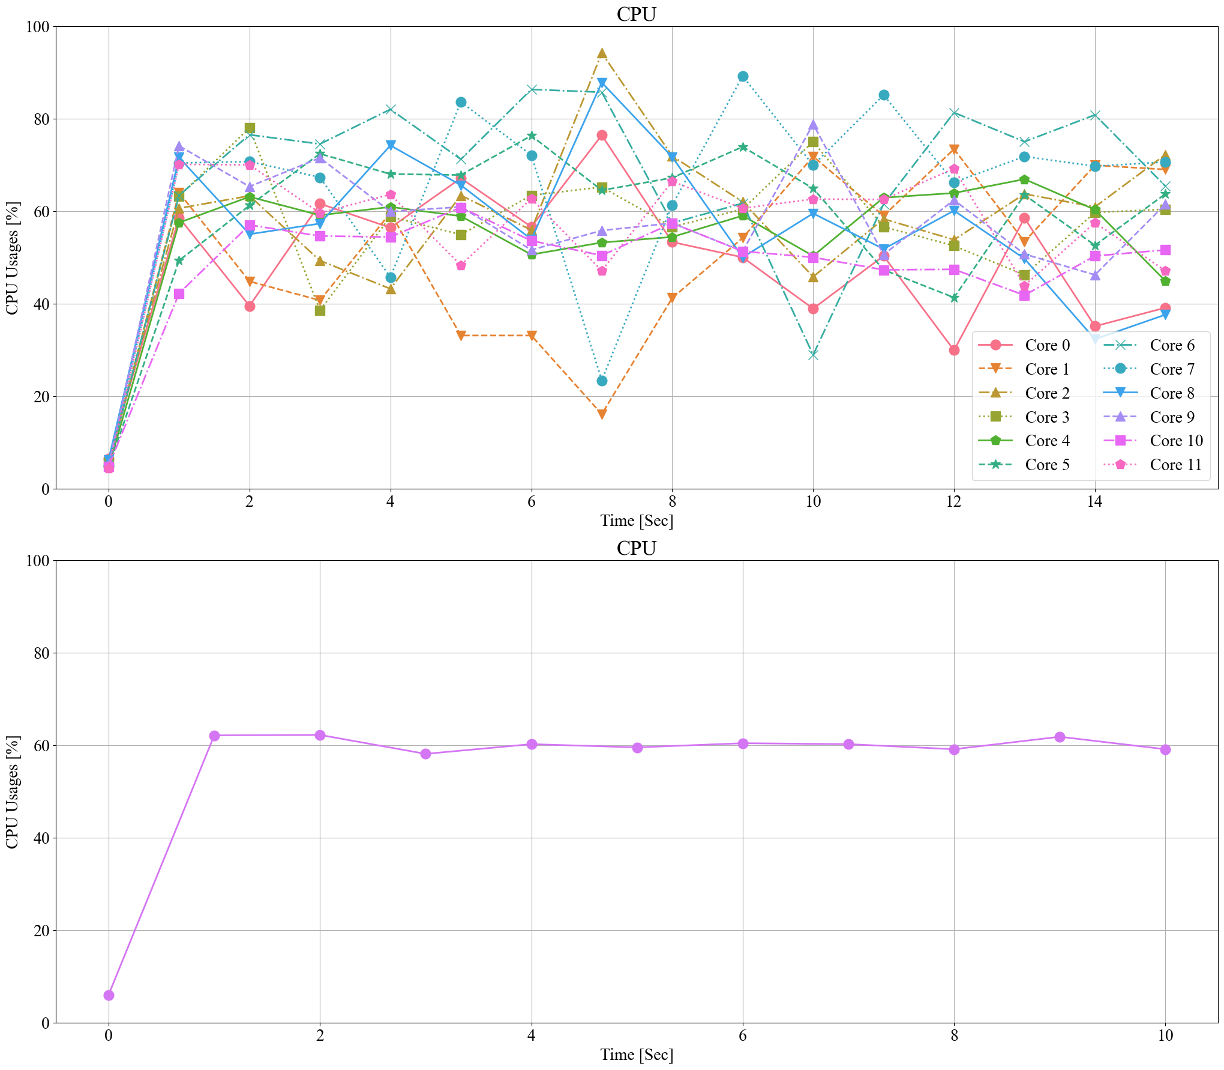
시간에 따른 CPU의 사용량을 각 코어에 따라 line chart로 시각화
Parameters:
| Name | Type | Description | Default |
tick | int | | 1 |
threshold | int | | 10 |
path | str | | 'CPU' |
dpi | int | Graph 저장 시 DPI (Dots Per Inch) | 100 |
per | bool | | True |
Returns:
Examples:
>>> zz.monitoring.cpu(threshold=15)
>>> zz.monitoring.cpu(per=False)
Source code in zerohertzLib/monitoring/cpu.py
| def cpu(
tick: int = 1,
threshold: int = 10,
path: str = "CPU",
dpi: int = 100,
per: bool = True,
) -> None:
"""시간에 따른 CPU의 사용량을 각 코어에 따라 line chart로 시각화
Args:
tick: Update 주기
threshold: 시각화할 총 시간
path: Graph를 저장할 경로
dpi: Graph 저장 시 DPI (Dots Per Inch)
per: CPU 개별 사용량 시각화 여부
Returns:
지정한 경로에 바로 graph 저장
Examples:
>>> zz.monitoring.cpu(threshold=15)
>>> zz.monitoring.cpu(per=False)
{ width="600" }
"""
tmp = 0
time_list = []
data = defaultdict(list)
while True:
time_list.append(tmp)
if per:
cpu_usages = psutil.cpu_percent(percpu=per)
for core, cpu_usage in enumerate(cpu_usages):
data[f"Core {core}"].append(cpu_usage)
else:
cpu_usage = psutil.cpu_percent(percpu=per)
data["CPU"].append(cpu_usage)
plot(
time_list,
data,
xlab="Time [Sec]",
ylab="CPU Usages [%]",
ylim=[0, 100],
ncol=2,
title=path,
figsize=(25, 10),
dpi=dpi,
)
time.sleep(tick)
tmp += tick
if tmp > threshold:
break
|