Skip to content

zerohertzLib.monitoring

Monitoring

현재 기기의 상태를 살펴볼 수 있는 함수들

Modules:

Name Description
cpu
gpu
storage

Functions:

Name Description
gpu_memory

시간에 따른 GPU의 memory 사용량을 각 GPU에 따라 line chart로 시각화

gpu_usages

시간에 따른 GPU의 사용량을 각 GPU에 따라 line chart로 시각화

__all__ module-attribute

__all__ = ['storage', 'cpu', 'gpu_memory', 'gpu_usages']

gpu_memory

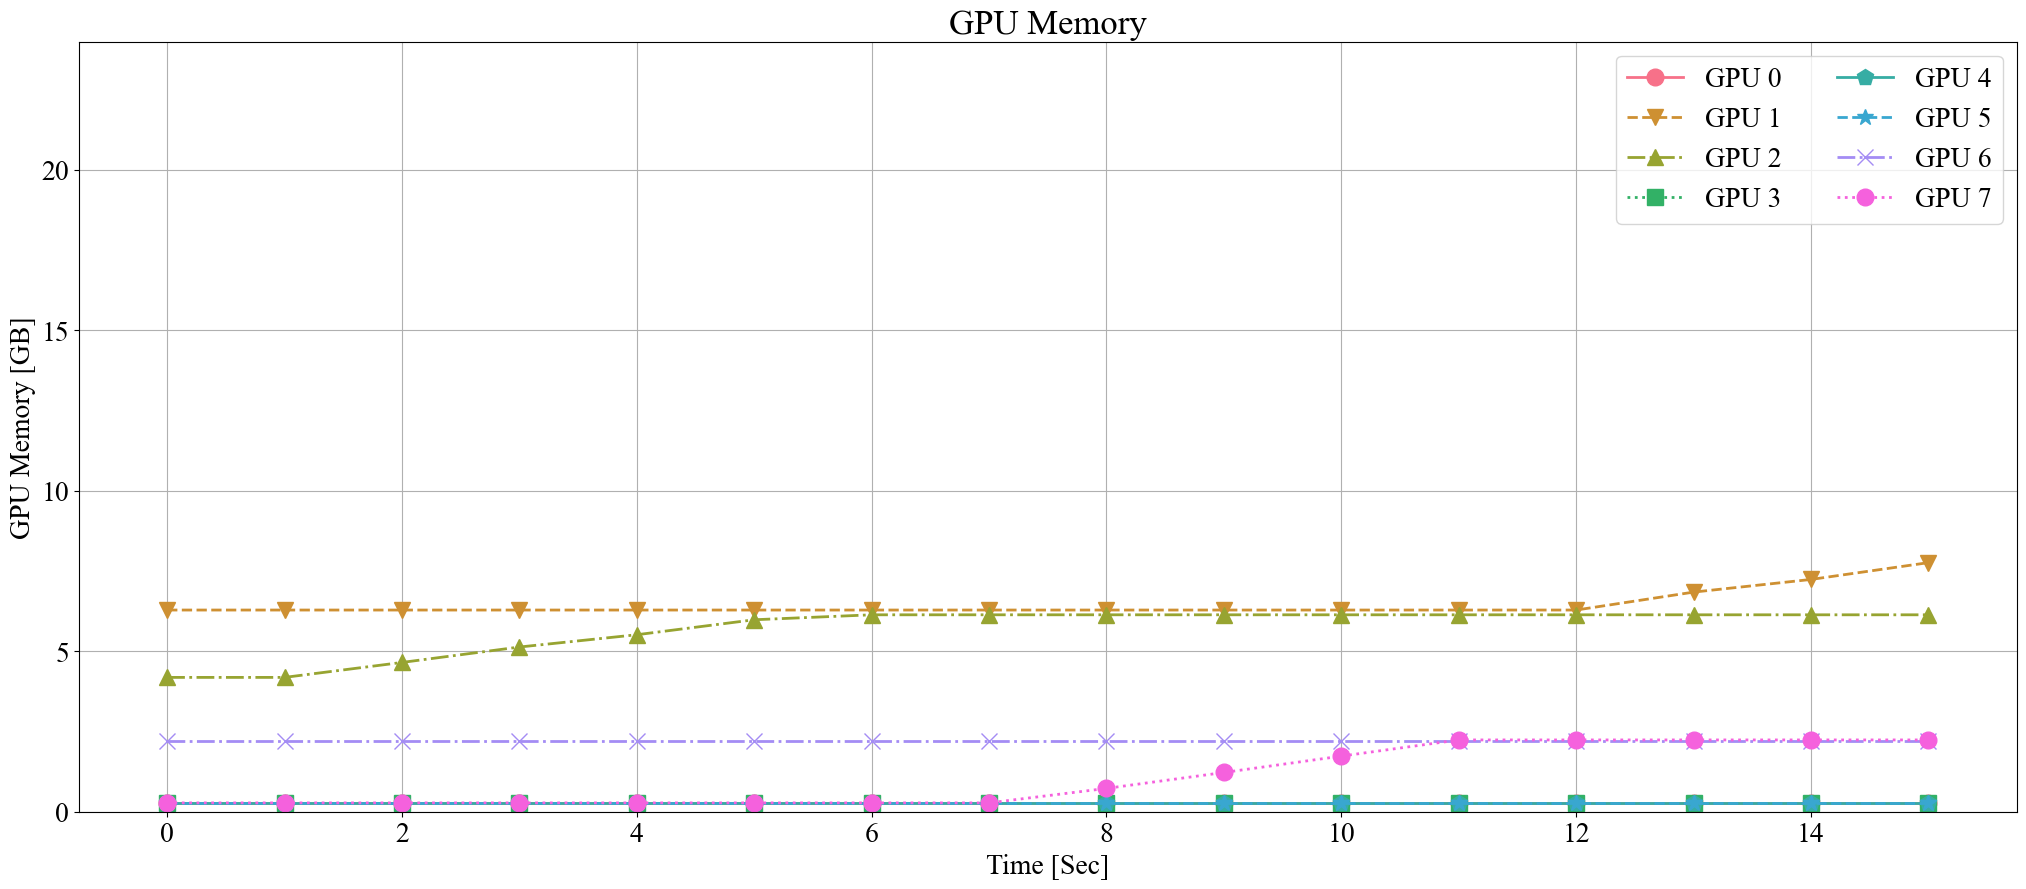
gpu_memory(tick: int = 1, threshold: int = 10, grep: list[int] | None = None, path: str = 'GPU Memory', dpi: int = 100) -> None

시간에 따른 GPU의 memory 사용량을 각 GPU에 따라 line chart로 시각화

Parameters:

Name Type Description Default
tick int

Update 주기

1
threshold int

시각화할 총 시간

10
grep list[int] | None

시각화할 GPU의 번호

None
path str

Graph를 저장할 경로

'GPU Memory'
dpi int

Graph 저장 시 DPI (Dots Per Inch)

100

Returns:

Type Description
None

지정한 경로에 바로 graph 저장

Examples:

>>> zz.monitoring.gpu_memory(threshold=15)

GPU memory monitoring example

Source code in zerohertzLib/monitoring/gpu.py
def gpu_memory(
    tick: int = 1,
    threshold: int = 10,
    grep: list[int] | None = None,
    path: str = "GPU Memory",
    dpi: int = 100,
) -> None:
    """시간에 따른 GPU의 memory 사용량을 각 GPU에 따라 line chart로 시각화

    Args:
        tick: Update 주기
        threshold: 시각화할 총 시간
        grep: 시각화할 GPU의 번호
        path: Graph를 저장할 경로
        dpi: Graph 저장 시 DPI (Dots Per Inch)

    Returns:
        지정한 경로에 바로 graph 저장

    Examples:
        >>> zz.monitoring.gpu_memory(threshold=15)

        ![GPU memory monitoring example](../../../assets/monitoring/gpu_memory.png){ width="600" }
    """
    tmp = 0
    time_list = []
    data = defaultdict(list)
    gpu_memory_max = 0
    while True:
        time_list.append(tmp)
        gpu_usages_list = _get_gpu_memory()
        for num, (gpu_memory_usage, gpu_memory_total) in enumerate(gpu_usages_list):
            if grep is None or num in grep:
                gpu_memory_max = max(gpu_memory_total / 1024, gpu_memory_max)
                data[f"GPU {num}"].append(gpu_memory_usage / 1024)
        plot(
            time_list,
            data,
            xlab="Time [Sec]",
            ylab="GPU Memory [GB]",
            ylim=[0, gpu_memory_max],
            ncol=2,
            title=path,
            figsize=(25, 10),
            dpi=dpi,
        )
        time.sleep(tick)
        tmp += tick
        if tmp > threshold:
            break

gpu_usages

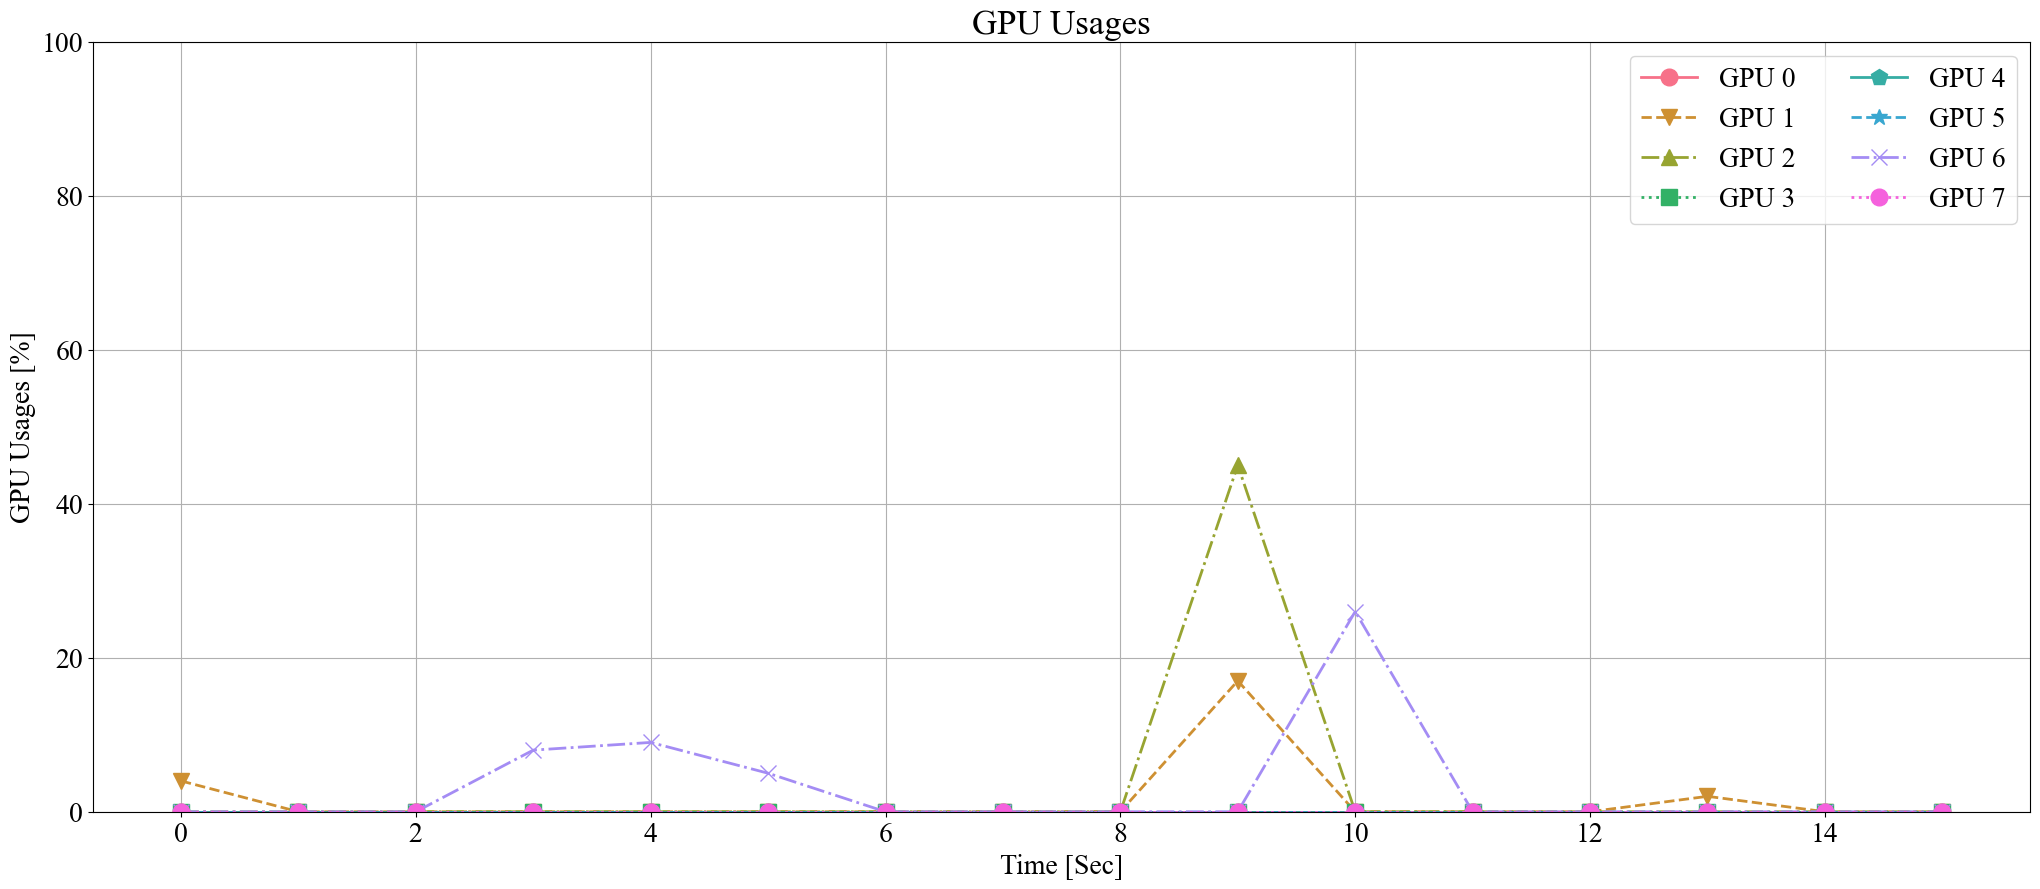
gpu_usages(tick: int = 1, threshold: int = 10, grep: list[int] | None = None, path: str = 'GPU Usages', dpi: int = 100) -> None

시간에 따른 GPU의 사용량을 각 GPU에 따라 line chart로 시각화

Parameters:

Name Type Description Default
tick int

Update 주기

1
threshold int

시각화할 총 시간

10
grep list[int] | None

시각화할 GPU의 번호

None
path str

Graph를 저장할 경로

'GPU Usages'
dpi int

Graph 저장 시 DPI (Dots Per Inch)

100

Returns:

Type Description
None

지정한 경로에 바로 graph 저장

Examples:

>>> zz.monitoring.gpu_usages(threshold=15)

GPU usage monitoring example

Source code in zerohertzLib/monitoring/gpu.py
def gpu_usages(
    tick: int = 1,
    threshold: int = 10,
    grep: list[int] | None = None,
    path: str = "GPU Usages",
    dpi: int = 100,
) -> None:
    """시간에 따른 GPU의 사용량을 각 GPU에 따라 line chart로 시각화

    Args:
        tick: Update 주기
        threshold: 시각화할 총 시간
        grep: 시각화할 GPU의 번호
        path: Graph를 저장할 경로
        dpi: Graph 저장 시 DPI (Dots Per Inch)

    Returns:
        지정한 경로에 바로 graph 저장

    Examples:
        >>> zz.monitoring.gpu_usages(threshold=15)

        ![GPU usage monitoring example](../../../assets/monitoring/gpu_usages.png){ width="600" }
    """
    tmp = 0
    time_list = []
    data = defaultdict(list)
    while True:
        time_list.append(tmp)
        gpu_usages_list = _get_gpu_usages()
        for num, gpu_usage in enumerate(gpu_usages_list):
            if grep is None or num in grep:
                data[f"GPU {num}"].append(gpu_usage)
        plot(
            time_list,
            data,
            xlab="Time [Sec]",
            ylab="GPU Usages [%]",
            ylim=[0, 100],
            ncol=2,
            title=path,
            figsize=(25, 10),
            dpi=dpi,
        )
        time.sleep(tick)
        tmp += tick
        if tmp > threshold:
            break